COVID-19 Test Transparency among Prison Systems

As we work to create accurate COVID case counts, it is critical to know the types of tests used by each prison system. Different tests have different information quality (i.e., how good they are at identifying those with COVID and without COVID) and have different types of information (i.e., detecting current COVID infection or those who have had COVID at any point). Both the quality and type of information are needed for us to know how accurate the data are and what story they tell.

From the information we have gleaned, we have various levels of detail. Fortunately, all prison systems we have heard from are using polymerise chain reaction (PCR) tests, which detect current infection rather than ever infection. PCR tests allow for more reliable information for individuals than antibody tests. While antibody tests help track the spread of COVID in a population, given the number of outbreaks in communal living settings, specifically in prisons, PCR tests are crucial. Beyond the fact that most prison systems are using PCR tests, additional information is scattered. Some states have been able to tell us the exact test brand and name (i.e., Georgia, Illinois, Maine), while others have said they don’t have more information than ‘nasal PCR swabs’ or generally ‘PCR tests.’ Still others have said that they work with too many labs to keep track or that they simply do not have the requested testing information.

In sum, 18 states have provided no information, 2 have said that this information is unavailable or unknown, 15 have provided us with some information (i.e., a PCR test is used), 5 states and both the BOP and ICE say they use multiple tests and labs, and 10 have provided full information including the type, name, and brand of test. Making testing information available that is both accurate and precise is critical as we and others track the spread of COVID in prisons. Without it, our information and knowledge is incomplete.
A Preliminary Analysis of Private Prison Facilities

Among the 53 prison systems that provide source data for the COVID Prison Project, 6 designate which of their facilities are public or private. We analyzed some of these data to get understand if there are differences in testing practices, and, subsequently, case rates in private and public facilities.

We found that private prisons have fallen behind their public counterparts in COVID testing and case detection. Among federal prisons, 6 out of the reported 11 private prisons are not reporting any COVID data (Big Spring FL, Big Spring, Dalby, Moshannon Valley, Reeves CI, Reeves DC). The five prisons reporting COVID data only report the number of inmates that have tested positive for COVID. As of June 8th, these private facilities have only reported a total of 72 positive cases and no testing information. This number has remained constant at 72 since reporting began on May 8th.

In Florida, private prisons have been slower to ramp up COVID testing than public facilities with three of the state’s five private prisons (Graceville, Lake City, Moore Haven) having tested fewer than 10 people who are incarcerated as of June 3, 2020. The state’s two private prisons that have detected COVID outbreaks are, unsurprisingly, the two that have tested over 1,200 inmates each (Gasden, South Bay). However, comparisons between Florida’s public and private facilities remain difficult, as certain private (South Bay) and public (Liberty) facilities that have detected COVID outbreaks are reporting a decreasing cumulative number of COVID tests, which technically should be impossible.

Among other states reporting testing data and information relevant to which facilities are private, Hawaii’s private prison has only tested three inmate and West Virginia one inmate as of June 8th. In Hawaii, though, testing numbers are low for all facilities (regardless of private vs. public designation).

While Georgia does not report the total number of tests, as of June 8th, no private facilities in Georgia had reported a change in the number of positive or recovered cases since May 4th whereas public facilities are reporting increasing numbers almost daily. In addition, Georgia’s private facilities are not reporting any staff information while the public facilities are.

We are able to glean more information from Arizona, where the total number of people in each facility is reported. As of June 3rd, private prisons have tested 0.68% of inmates whereas public prisons have tested 4.63%. Of those tested, private prisons have found 21% of inmates to be positive and public prisons have found 12% to be positive, indicating a dire need for further testing.

In summary, we are still learning more about private facilities, and while many states do not report which facilities are private, where information is available, private facilities are, in many cases, testing less, waiting longer to enact robust testing measures, and are reporting fewer cases even when reporting higher rates of test positivity.

COVID Prison Project Data Dictionary

Last updated: June 10, 2020

CPP collects daily data from 53 sources: each state prison system, ICE, the Federal Bureau of Prisons, and Puerto Rico. Over the past few months, we have carefully considered how to define our data. Each system reports their data differently, defines their data differently, and includes different data points. Some states are inclusive of community supervision, some include jail systems. And, many states’ data reporting systems change constantly. So, in the name of data integrity and transparency, we have created a data dictionary both for our team and for you who may be viewing and using the data. This document is living and breathing, changing constantly. You can find it here: https://docs.google.com/document/d/1XKLrAtT2UEsQ_fcicwWJRnHCh6zR5eZptG06bjtfEZg/edit?usp=sharing

For each state our data dictionary includes:

Where the data was sourced from, with a link to the system’s data page.

The system’s definition of its data and which variables they are reporting.

CPP’s definitions of the data. Sometimes systems remove positive cases when they are “recovered”. We add them back in to get a cumulative count. Sometimes systems don’t report cumulative testing numbers but instead report number of pending, positive, and negative numbers. We add those all up. In the data dictionary, we detail this unique process for each state.

If you have questions about the data dictionary or thoughts on how we can improve it please reach out to us!

COVID Case Watch June 3, 2020

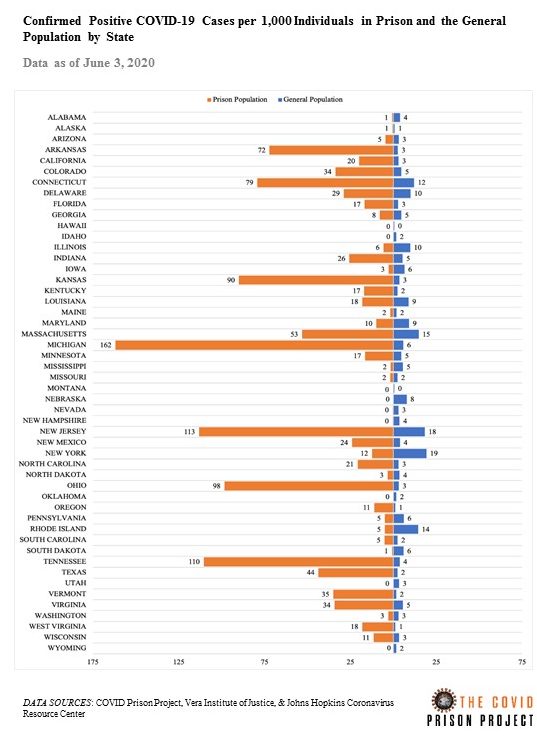
This graph shows the confirmed positive COVID-19 rate per 1,000 individuals in the prison population and the general population for each state as of June 3rd, 2020. The left side of the graph (orange) refers to the prison population and the right side of the graph (blue) refers to the general population. The rates calculated here use new state prison population data from the Vera Institute of Justice which better adjusts for COVID-19 related releases.

The confirmed positive COVID-19 case rate has increased in the prison population in more than half of states since last week, with the largest increases in Michigan (increase of 76 per 1,000), New Jersey (increase of 36 per 1,000), and Texas (increase of 20 per 1,000).

The confirmed case rate in the prison population is now above 100 in three states (Michigan, New Jersey, and Tennessee) and approaching 100 in two more (Ohio and Kansas). In fact, the confirmed COVID-19 case rate is around 30x greater in the prison population than the general population in the states of Ohio, Tennessee, and Michigan.

Data Collection Update

We have changed how we are reporting testing and case rates on the Data by State page. Previously, we used the 2018 year end prison population numbers released April 30, 2020 from the Bureau of Justice Statistics for the denominator. Since these data are old, and there have been recent changes to prison populations, we are now using more recent population data collected by the Vera Institute of Justice. For all states, minus the exceptions below, the population data are for April 30/May 1, 2020. For the following states we use population data for March 31, 2020: Montana, South Dakota, Tennessee, and Washington. For the following states we use population data for December 31, 2019: Illinois, Maryland, Minnesota, Montana, New Mexico, and Virginia. These represent the most recent data available.

Our testing rates represent the number of tests per population. It is possible that some states are testing the same person more than once. Only one state is reporting the number of people tested separately from the number of tests given. As an example, Michigan has now reported more tests for COVID-19 (37,885) than there are people currently incarcerated in their prisons (36,980), likely due to releasing people from prison, widespread testing practices (including repeat testing), and deaths.

Last updated June 4, 2020.

COVID Case Watch May 27, 2020

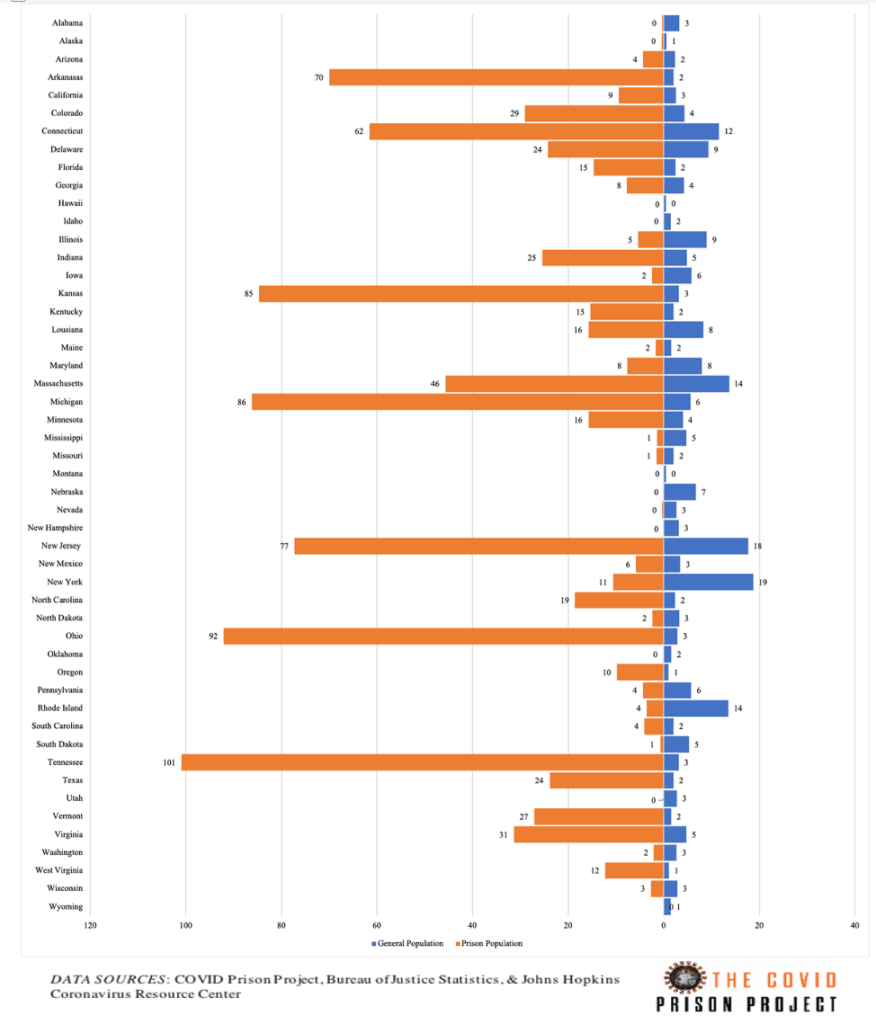
This graph shows the confirmed positive COVID-19 rate per 1,000 individuals in the prison population and the general population for each state as of May 27th, 2020. The left side of the graph (orange) refers to the prison population and the right side of the graph (blue) refers to the general population.

In the last two weeks, confirmed case rates in the prison population increased in nearly all states. The largest increase in the confirmed case rate among the prison population occurred in New Jersey where there was a 300% increase (from 19 per 1,000 to 77 per 1,000). Other states with large increases in the confirmed case rate among the prison population are Tennessee (increase of 40 per 1,000), Michigan (increase of 30 per 1,000), Connecticut (increase of 23 per 1,000), Texas and Kansas (increase of 13 per 1,000), and West Virginia (increase of 12 per 1,000). The states with the highest confirmed positive rate in the prison population are Tennessee, Ohio, Michigan, and Kansas.

COVID-19 Case Watch: Preliminary Data from Jails

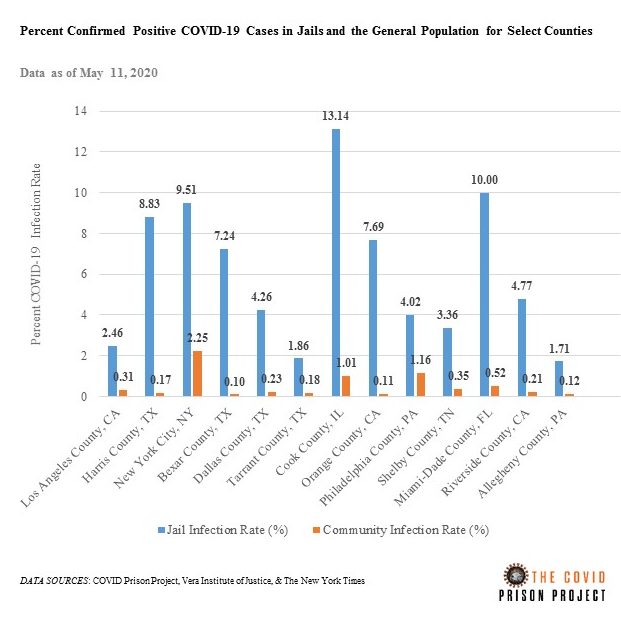
In counties with some of the largest jails, the COVID-19 infection rate in jails is between 3.5 and 73.1 times higher than the overall county infection rate. Cook County Jail has the highest infection rate; however, Bexar County has the largest disparity between the jail and the county overall. The infection rate in Bexar County Jail is 7.24%, which is 73.1 times higher than the 0.10% infection rate for Bexar County overall. Similar to prisons, infection rates in jails are dependent on testing. For example, Harris County Jail in Houston, TX has engaged in widespread testing.

Methods: While we are not systematically tracking COVID-19 cases in jails yet, we conducted this preliminary analysis. The raw data are provided in Table 1. The Vera Institute of Justice has been monitoring jail populations during COVID-19. We used their daily population counts for the denominator. The numerator data come from either government sources or media sources. The links for each report are provided in the table. The community infection rates are from The New York Times (data from May 11, 2020 8:10am ET).

Data Collection Methods

In this blog post, we detail how we are collecting data and how our data may be different from other sources. If you still have questions after viewing this blog post, please contact us.

How are you collecting data?

We are collecting data manually. Every day of the week (Sun thru Sat) a team member checks the website for all 52 prison systems (50 states, Federal BOP, ICE). As of now, we are not including media reports, which may have more accurate and timely data. The links to the source websites where we are finding our data are posted on the state data page of our website.

We enter the data into a spreadsheet, aggregate it, and then post it to the website. There is one exception for the state of New Mexico. They have not yet started reporting their data regularly on their website. So, our staff called them on May 4 to ask for their data. The “last updated” date is not the date that the latest data was released by the institution but is the latest date that we checked for data on their website. Some systems are releasing data every day, some every business day, and some every few days. Because institutions sometimes change the way they report data, we check them all every day. We are working on automating this process using web scraping, but we will continue to check the data manually due to some caveats, which are outlined below.

What kind of data are you collecting?

We are collecting everything! If a system is reporting it, we are recording it. We are purposeful in the way that we aggregate data for public presentation. Every system is reporting data in different ways, so we had to make some decisions in order to standardize the data. For example, some systems are reporting confirmed COVID-19 deaths, suspected COVID-19 deaths, COVID-19 deaths pending autopsy, and or confirmed COVID-19 deaths with underlying causes. Some systems only report COVID-19 “deaths” without any further information. As of now, we aggregate all COVID-19 related deaths. As another example some department of corrections include probation and parole and report numbers of cases in that population too. We have intentionally decided to exclude those case counts in our totals for now. We are still collecting it, though, and will include these numbers later when we have more capacity to report publicly all the data we have collected.  We are in the process of editing our data dictionary for public use and will post it soon. The data dictionary includes case definitions and all the data peculiarities for each institution.

What are the strengths and limitations of your data?

All data has strengths and limitations, and it is important to understand these when using data. We have been collecting data at the facility level for every state and the BOP every day since April 22. We have some data for some institutions prior to April 22, but it is not consistent. Since our data is collected manually, we are able to set criteria and exclude/include cases based on that criteria. We are also able to see when institutions change the way they are reporting data and correct it in our files. For example, some states changed their reporting of COVID-19 cases so that they are no longer cumulative. We have to use our historic data and the new data they present to make sure that we are presenting cumulative counts. These are some of the strengths of our data. However, relying on humans to do this work, rather than computers, also creates some limitations. Humans make typos and other errors. We do have some redundancy built into our process to catch errors as soon as possible.

How is your data different then other collections?

Each dataset on COVID-19 and corrections will have some differences. For example, the Marshall Project also collected data on COVID-19 and corrections. Their methodology was very different from ours, however. They called the institutions once a week to collect cumulative data over the phone. They also only collected data for a finite period of time, rather than continuously. It might be good practice to use multiple data sources to triangulate your findings. We too are working to see if there are ways for us to combine our data with the Marshall Project to make more robust the complete data picture here at the COVID Prison Project.

Last updated May 19, 2020.

Welcome!

This project was launched by a group of interdisciplinary scientists who work at the intersection of public health and criminal justice. We hope to fill a major gap in how COVID-19 in correctional settings is reported, tracked, and analyzed. 

The risk posed by infectious diseases in prisons and jails is significantly higher than in the community, both in terms of risk of transmission, exposure, and harm to individuals who become infected. This is true of other group living facilities, such as nursing homes and assisted living facilities. In correctional facilities, risk is driven by close-quarter unsanitary living conditions and limited access to hygiene products. Moreover, people in prisons tend to have a higher burden of health conditions that may make them more susceptible to COVID-19, because they overwhelmingly come from our most marginalized neighborhoods.

Some jails and prisons have worked to change policy to release people and modify their policies on the inside to prevent disease transmission. Some have not. Regardless of these actions, many jails and prison across the country have become the epi-center of the COVID-19 pandemic in America, with outbreaks occurring in large urban jails (e.g. Riker’s Island, Cook County Jail) and prison facilities (in Ohio, North Carolina, Michigan and other states).  

While we are reporting these data, it is important to keep in mind a few things. First, these data are preliminary. Just like reporting by departments of public health, it will likely be months (or years) before we have a complete set of valid data. Still, it is important to monitor these trends as they develop over time. Second, we caution against comparing the number of cases and the number of tests within departments of correction across states. States vary in the type of information they are reporting. The number of cases directly correlates to the number of tests, meaning that states that are doing more testing will have a higher number of positive cases. Testing guidelines for prisons are likely shaped by other state agencies (e.g., departments of public health). And, the inmate population size and correctional management strategies (e.g., inmate housing) vary by state. We think it is more useful to compare what is happening in prisons to what is happening in the community within their state. Third, it is important to keep in mind that there is a natural lag in reporting: from the time someone is tested, to when results are received, to when they are reported internally, and, finally, to when they are reported publicly. Our data come from the information that is publicly reported by departments of correction. The most common way that states are reporting information about prisons is through their website, but this is not always the case. 

Over the coming weeks, we hope to grow our website and make it more interactive. So please check back often for new content. If you are a prison administrator, and you have more accurate data that you want to share with us, please contact us! We also welcome ideas and questions from viewers.