*Note: This post is regularly updated with the most current information by Forrest Behne.
Each U.S. state is developing programs to plan and operationalize a vaccination response to COVID-19 within their jurisdiction based on the Centers for Disease Control and Prevention (CDC) COVID-19 Vaccination Program Interim Playbook for Jurisdiction Operations, released October 29, 2020. States were tasked with developing a vaccine plan that includes three phases, ordered from highest to lowest priority, and ensuring equitable access for CDC defined “critical populations,” including (1) critical infrastructure workforce, (2) people at increased risk for severe COVID-19 illness, (3) people at increased risk of acquiring or transmitting COVID-19, and (4) people with limited access to routine vaccination services.
CPP analyzed each of these plans to identify in which phase incarcerated people are targeted for COVID-19 vaccination. Thirty-four (34) States/Territories have, so far, included incarcerated populations as part of their Phase 1 vaccine distribution; of these 34 States/Territories, three (3) have specifically prioritized incarcerated populations that are medically vulnerable to COVID-19. These states are Arizona, South Dakota, and Utah. Medically vulnerable populations include incarcerated people that are over the age of 65 or have two or more chronic conditions. Four (4) states include incarcerated populations as part of their Phase 2 vaccine distribution. Tennessee and Missouri designate incarcerated populations for vaccination in phase 3 while correctional staff are targeted for Phase 1. We have categorized Montana as Phase 1 but must note that they organized their prioritization categories as tiers, making their plan more difficult to discern. Thirteen (13) states did not explicitly identify how they would prioritize incarcerated populations in the distribution of vaccines.
The image below shows how states have categorized incarcerated people into various phases for vaccine distribution. This analysis and figure are being updated as revisions to the states’ final plans occur. Vaccination plans may not be reflective of actual distribution. See our COVID-19 Vaccine Doses page for further details.
This graph shows confirmed positive cases of COVID-19 per 1,000 individuals in the prison and general populations in each state as of March 11, 2021. The left side (orange) refers to the prison population and the right side (blue) refers to the general population.
The rate of COVID in the general population is 87.33 per 1,000 individuals. In the prison population, the rate is 277.35 per 1,000 individuals. On average, the rate of COVID infections in prison populations remains over 3 times the rate of COVID infections in the general population.
In 47 of the 50 US states, the burden of COVID among those imprisoned still exceeds that in the general population. In the last week, the largest increase in prison population case rates in the last week occurred in Vermont. While 218 of Vermont’s 1,369 incarcerated people had received a positive COVID test by last week, 236 had received a positive test by today. The highest case rate in the state prison systems remains in Michigan with 25,459 of its incarcerated population (688.45 per 1,000) having tested positive for COVID. Over half of the state’s prison population has tested positive for COVID in Alaska, Arkansas, Iowa, Kansas, Michigan, and South Dakota.
Importantly, states have varying testing strategies within prisons and for their general population, indicating that these rates likely reflect a falsely low disease incidence with some states’ rates being more accurate than others.
This graph shows confirmed positive cases of COVID-19 per 1,000 individuals in the prison and general populations in each state as of March 4, 2021. The left side (orange) refers to the prison population and the right side (blue) refers to the general population.
The rate of COVID in the general population is 86.81 per 1,000 individuals. In the prison population, the rate is 275.95 per 1,000 individuals. On average, the rate of COVID infections in prison populations remains over 3 times the rate of COVID infections in the general population. Hawaii and Michigan continue to have prison infection rates that are over 10 times that of the state general population.
In 47 of the 50 US states, the burden of COVID among those imprisoned still exceeds that in the general population. In the last week, the largest increases in prison population case rates in the last week occurred in Montana and Vermont. While 90 of Vermont’s 1,369 incarcerated people had received a positive COVID test by last week, 218 had received a positive test by today. The highest case rate in the state prison systems remains in Michigan with 25,359 of its incarcerated population (685.75 per 1,000) having tested positive for COVID. Over half of the state’s prison population has tested positive for COVID in Alaska, Arkansas, Iowa, Kansas, Michigan, and South Dakota.
Importantly, states have varying testing strategies within prisons and for their general population, indicating that these rates likely reflect a falsely low disease incidence with some states’ rates being more accurate than others.
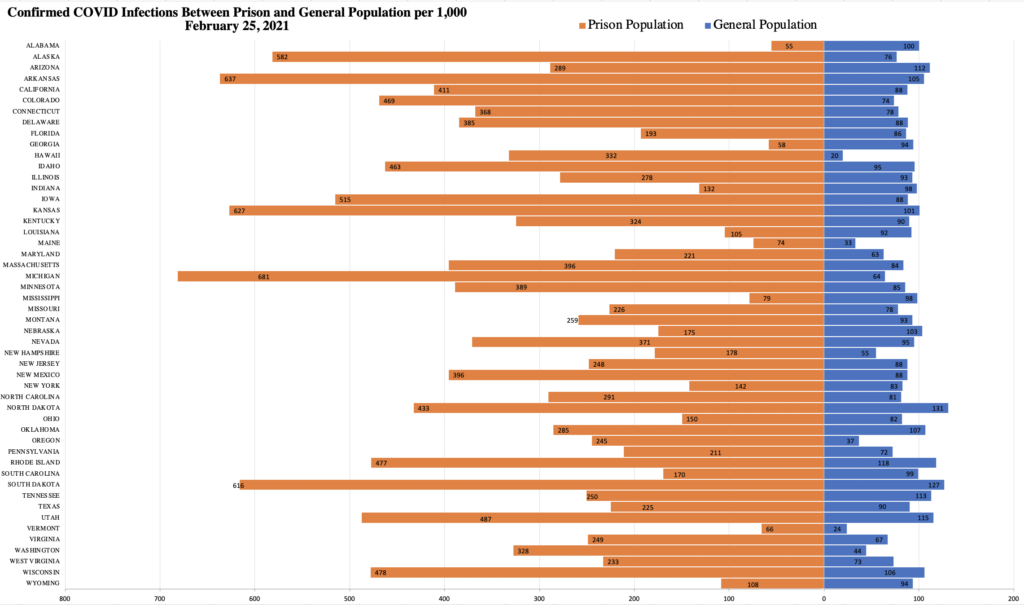
This graph shows confirmed positive cases of COVID-19 per 1,000 individuals in the prison and general populations in each state as of February 25, 2021. The left side (orange) refers to the prison population and the right side (blue) refers to the general population.
The rate of COVID in the general population is 85.49 per 1,000 individuals. In the prison population, the rate is 273.68 per 1,000 individuals. On average, the rate of COVID infections in prison populations is over 3 times the rate of COVID infections in the general population. Hawaii and Michigan continue to have prison infection rates that are over 10 times that of the state general population.
Despite the continued surge of COVID cases in the general population in the last few months, in 47 of the 50 US states, the rate of COVID infections among those imprisoned still exceeds the rate of COVID infections among the general population. In the last week, case rates have continued to increase drastically in prisons in multiple states. The largest increases in prison population case rates in the last week occurred in Vermont and Wyoming. The highest case rate in the state prison systems remains in Michigan with 25,198 of its incarcerated population (681.40 per 1,000) having tested positive for COVID. Over half of the state’s prison population has tested positive for COVID in Alaska, Arkansas, Iowa, Kansas, Michigan, and South Dakota.
Importantly, states have varying testing strategies within prisons and for their general population, indicating that these rates likely reflect a falsely low disease incidence with some states’ rates being more accurate than others.
Written by Sarah Khorasani and Alysse Wurcel, MD MS, Tufts Medical Center, Department of Medicine
Criminal-legal involved populations, including people incarcerated in jail and prison, face a disproportionate burden of both chronic and infectious diseases. In particular, the conditions of confinement increase the transmission risks of respiratory infections like COVID-19 and influenza in carceral settings. Amid the ongoing COVID-19 vaccine distribution efforts, many reports have highlighted hesitation to get the vaccine, particularly among communities of color and people from lower-income communities.
In Massachusetts, people in congregate settings, including people incarcerated in jail, have been prioritized for COVID-19 vaccination. Although prioritization is a crucial and necessary step to vaccinating an already vulnerable population, we must acknowledge that offers of vaccination may not be universally accepted.
Influenza, which shares a transmission mechanism with COVID-19, is responsible for millions of illnesses and tens of thousands of deaths annually in the US despite the existence of effective vaccines. However, there has been limited research and policy related to influenza vaccinations in jails, and no research that we are aware of examines the acceptance of flu vaccines among people incarcerated in jails.
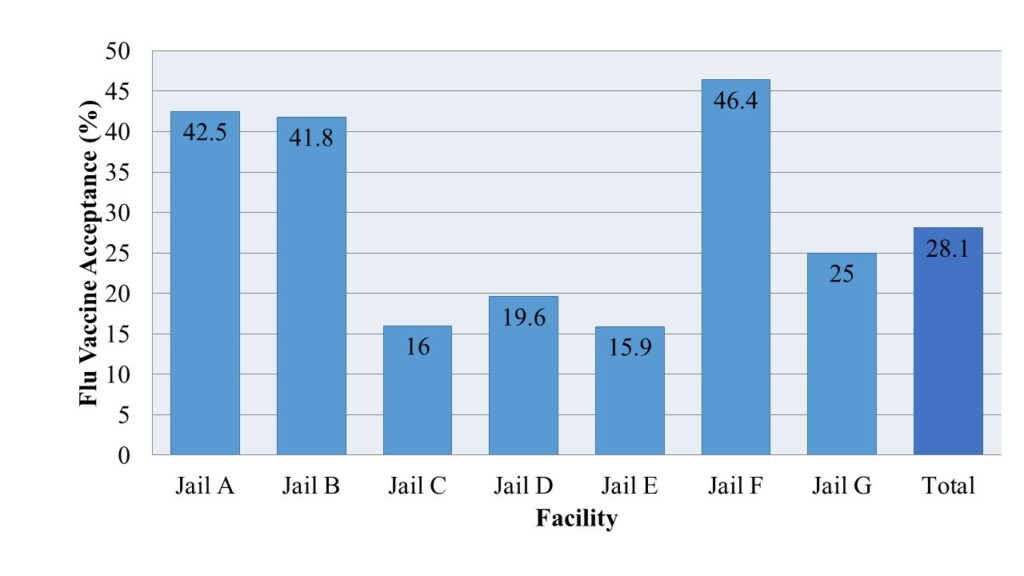
Our work in Massachusetts has identified heterogeneous flu-related policies and infrequent acceptance of influenza vaccines in jails. We gathered flu vaccine acceptance data from first-pass vaccination efforts in Massachusetts jails in the hope that these data would shed light on gaps in care that may impact health outcomes and delivery of the COVID-19 vaccine among people who are incarcerated.
Influenza vaccine acceptance rates among people incarcerated in Massachusetts jails, September-October 2020 (Total n=3246)
Of the fourteen jails in Massachusetts, seven responded to our request for information. Overall, the flu vaccine acceptance rate was 28.1%, ranging between 15.9% and 46.4% across facilities. Not all people experiencing incarceration in each facility were offered vaccines during initial vaccination efforts. Four of the seven facilities had an acceptance rate at or below 25% among over 2000 people offered vaccines. Two of the facilities with an acceptance rate over 40% offered the vaccine to fewer than 200 people, while the third facility offered the influenza vaccine to nearly 1000 individuals.
While prioritizing vaccination for infectious diseases among those experiencing incarceration is essential for improved outcomes and health equity, ensuring that people in carceral settings are vaccinated requires more than getting vaccines to correctional facilities.
Vaccine delivery to carceral settings is in itself a particular and under-studied challenge that bears careful examination as COVID-19 vaccine distribution efforts continue. During the H1N1 influenza pandemic in 2009-2010, a narrow majority of federal and state prisons received the vaccine though only 28% of jails did. Distribution of vaccinations to all carceral settings regardless of size and type must improve. Even with improved distribution mechanisms, however, the presence of vaccines means little if the people who need them do not want them.
Low vaccine acceptance is particularly likely in a population that has faced decades of exploitation by the criminal-legal and medical establishments and is often forgotten about in discussions of public health. The structure of the correctional system itself also serves to augment already incredible racial inequities. This is particularly meaningful given that studies on vaccine hesitancy, or the factors, behaviors, and attitudes related to the delay or refusal of vaccination, have noted marked racial differences in influenza vaccination rates and in reasons for avoiding vaccination. Communities of color regularly express more hesitancy than their white peers with reasons for vaccine hesitancy including perceived need for vaccine, perceived safety and efficacy of vaccines, and childhood experiences. Perceived racial fairness has also been associated with increased probability of vaccination among black adults.
COVID-19 has highlighted the unique risks and the significant health inequities experienced by people incarcerated in jails and prisons. The close quarters and limited movement allowed in carceral settings particularly restrict infection mitigation efforts. The spread of COVID-19 in carceral settings not only affects the health of those who are incarcerated but also the health of the surrounding communities. Vaccines offer a safe and cost-effective way to prevent many infectious diseases, including COVID-19 and influenza.
Correctional facilities are critical sites for preventive care including through safe and effective vaccines for influenza, but people incarcerated in Massachusetts jails during initial influenza vaccination efforts for the 2020-2021 influenza season were unlikely to accept vaccination. Though the data discussed here represent only a small subsection of correctional facilities and the populations they house, they are evidence that further work is necessary to identify barriers to vaccination. These data also indicate significant potential challenges in COVID-19 vaccination efforts.
We must prioritize and engage people experiencing incarceration to build trust in vaccination efforts with the ultimate goal of improving health outcomes and health equity. Further research into vaccine hesitancy both for influenza vaccines and for the COVID-19 vaccines in correctional settings will be essential to protect the health of our communities and their most vulnerable members.
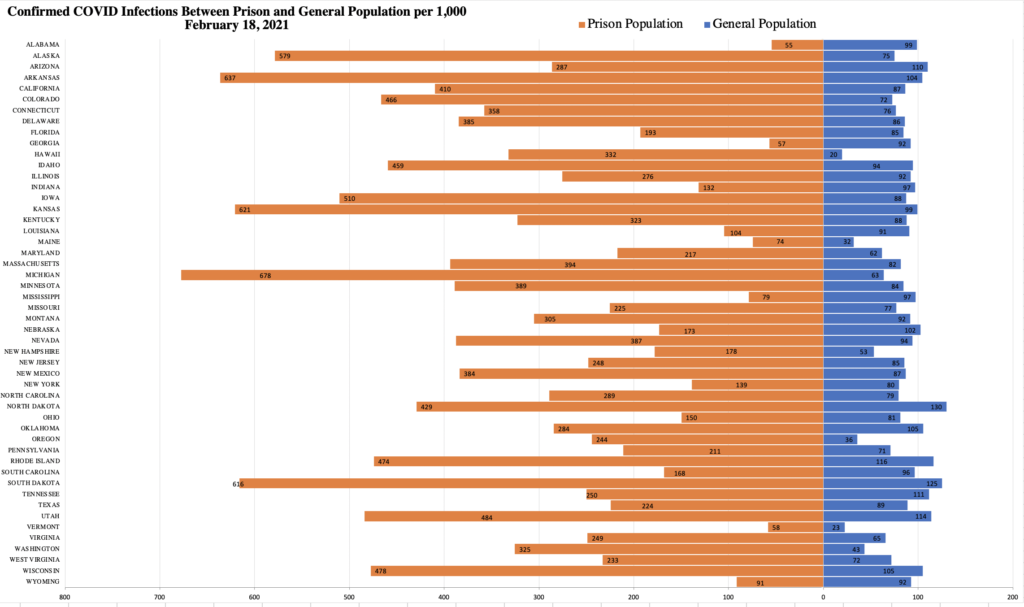
This graph shows confirmed positive cases of COVID-19 per 1,000 individuals in the prison and general populations in each state as of February 18, 2021. The left side (orange) refers to the prison population and the right side (blue) refers to the general population.
The rate of COVID in the general population is 84.04 per 1,000 individuals. In the prison population, the rate is 273.59 per 1,000 individuals. On average, the rate of COVID infections in prison populations is over 3 times the rate of COVID infections in the general population. Hawaii and Michigan continue to have prison infection rates that are over 10 times that of the state general population.
Despite the continued surge of COVID cases in the general population in the last few months, in 46 of the 50 US states, the rate of COVID infections among those imprisoned still exceeds the rate of COVID infections among the general population. Wyoming’s general population recently surpassed its prison population in the total COVID infection rate. In the last week, case rates have continued to increase drastically in prisons in multiple states. The largest increases in prison population case rates in the last week occurred in New York and Vermont. The highest case rate in the state prison systems remains in Michigan with 25,055 of its incarcerated population (677.53 per 1,000) having tested positive for COVID. Over half of the state’s prison population has tested positive for COVID in Alaska, Arkansas, Iowa, Kansas, Michigan, and South Dakota.
Importantly, states have varying testing strategies within prisons and for their general population, indicating that these rates likely reflect a falsely low disease incidence with some states’ rates being more accurate than others.
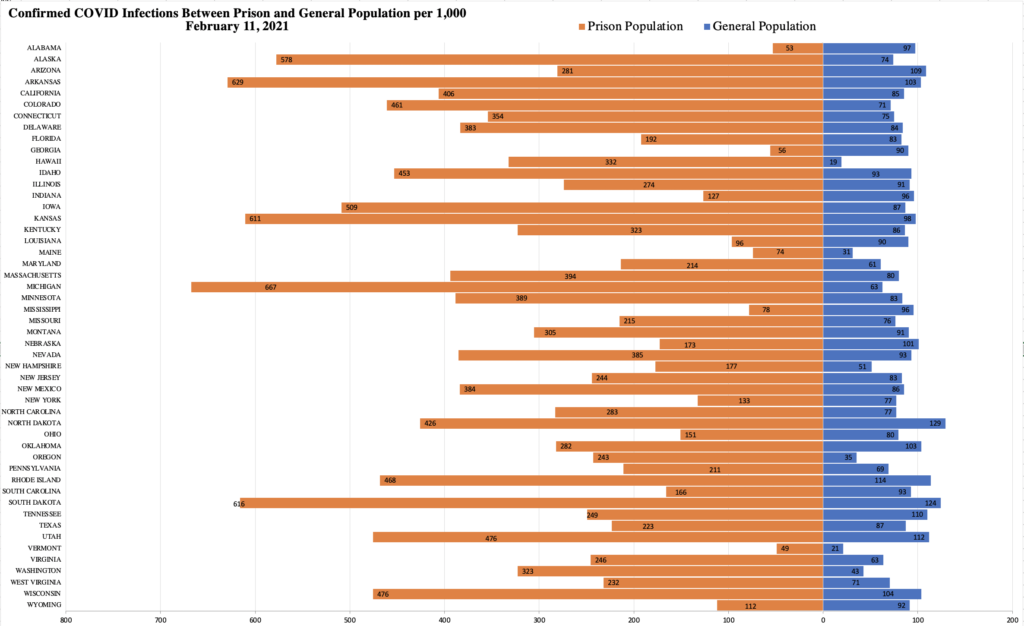
This graph shows confirmed positive cases of COVID-19 per 1,000 individuals in the prison and general populations in each state as of February 11, 2021. The left side (orange) refers to the prison population and the right side (blue) refers to the general population.
The rate of COVID in the general population is 82.50 per 1,000 individuals. In the prison population, the rate is 269.81 per 1,000 individuals. On average, the rate of COVID infections in prison populations is over 3 times the rate of COVID infections in the general population. Hawaii and Michigan continue to have prison infection rates that are over 10 times that of the state general population.
Despite the continued surge of COVID cases in the general population in the last few months, in 47 of the 50 US states, the rate of COVID infections among those imprisoned still exceeds the rate of COVID infections among the general population. The three states with a higher COVID rate in the general population continue to be in the Deep South: Alabama, Georgia, and Mississippi. In the last week, case rates have continued to increase drastically in prisons in multiple states. The largest increases in prison population case rates in the last week occurred in Wyoming and New York. The highest case rate in the state prison systems remains in Michigan with 24,681 of its incarcerated population (667.41 per 1,000) having tested positive for COVID. Over half of the state’s prison population has tested positive for COVID in Alaska, Arkansas, Iowa, Kansas, Michigan, and South Dakota.
Importantly, states have varying testing strategies within prisons and for their general population, indicating that these rates likely reflect a falsely low disease incidence with some states’ rates being more accurate than others.
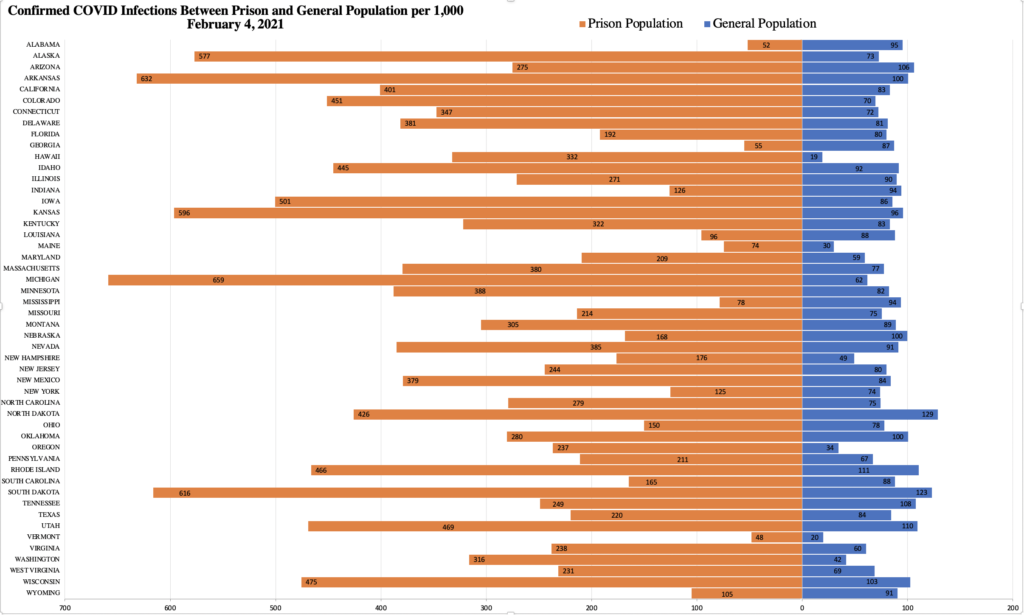
This graph shows confirmed positive cases of COVID-19 per 1,000 individuals in the prison and general populations in each state as of February 4, 2021. The left side (orange) refers to the prison population and the right side (blue) refers to the general population.
The rate of COVID in the general population is 80.34 per 1,000 individuals. In the prison population, the rate is 266.60 per 1,000 individuals. On average, the rate of COVID infections in prison populations is over 3 times the rate of COVID infections in the general population. Hawaii and Michigan continue to have prison infection rates that are over 10 times that of the state general population.
Despite the continued surge of COVID cases in the general population in the last few months, in 47 of the 50 US states, the rate of COVID infections among those imprisoned still exceeds the rate of COVID infections among the general population. The three states with a higher COVID rate in the general population continue to be in the Deep South: Alabama, Georgia, and Mississippi. In the last week, case rates have continued to increase drastically in prisons in multiple states. The largest increase in prison population case rates in the last week occurred in Arizona. Last week, 9,704 individuals in its prison population of 41,386 had tested positive and by February 4th, 11,385 had. Case rates in prisons have also increased drastically in Wyoming. The highest case rate in the state prison systems remains in Michigan with 24,638 of its incarcerated population (651.54 per 1,000) having tested positive for COVID. Over half of the state’s prison population has tested positive for COVID in Alaska, Arkansas, Iowa, Kansas, Michigan, and South Dakota.
Importantly, states have varying testing strategies within prisons and for their general population, indicating that these rates likely reflect a falsely low disease incidence with some states’ rates being more accurate than others.
CDC guidance states that incarcerated people and staff should be vaccinated in the same phase since both groups are at increased risk of contracting COVID-19. Despite this, almost all states/territories prioritize correctional staff over incarcerated people for vaccination.
We analyzed the most recent edition of each state’s vaccine distribution plan to compare the prioritization of correctional staff and incarcerated people. As indicated in the graphic below, there are significant discrepancies between these two groups. Incarcerated people are categorized in Phase 1 in only 48% of states, whereas staff are categorized in Phase 1 in 72% of states. Similarly, incarcerated populations are not categorized into in any phase in vaccination plans in 23% of states, whereas correctional staff are only left out of 14% of state vaccination plans.
For more insight into COVID-19 vaccinations in correctional facilities, check out our blog post about vaccination plans in each state and our vaccine dose tracker!
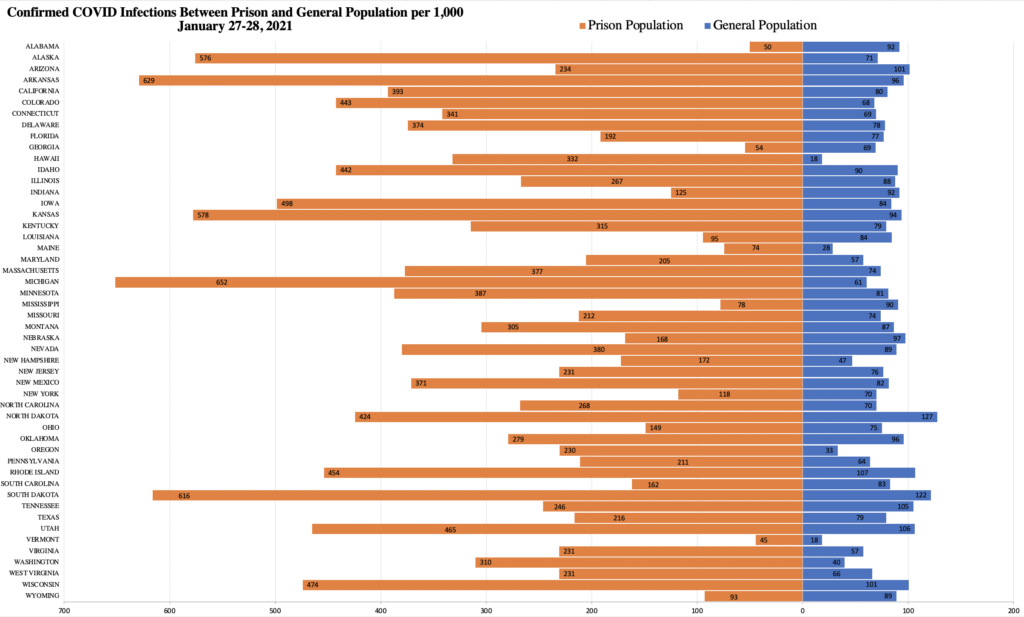
This graph shows confirmed positive cases of COVID-19 per 1,000 individuals in the prison populations in each state as of January 28, 2021 and general populations in each state as of January 27, 2021. The left side (orange) refers to the prison population and the right side (blue) refers to the general population.
The rate of COVID in the general population is 76.61 per 1,000 individuals. In the prison population, the rate is 261.27 per 1,000 individuals. On average, the rate of COVID infections in prison populations is over 3.4 times the rate of COVID infections in the general population. Hawaii and Michigan continue to have prison infection rates that are over 10 times that of the state general population.
Despite the continued surge of COVID cases in the general population in the last two months, in 47 of the 50 US states, the rate of COVID infections among those imprisoned still exceeds the rate of COVID infections among the general population. The three states with a higher COVID rate in the general population continue to be in the Deep South: Alabama, Georgia, and Mississippi. In the last week, case rates have continued to increase drastically in prisons in multiple states. The largest increase in prison population case rates in the last week occurred in Texas. Last week, 25,806 individuals in its prison population of 151,126 had tested positive and by January 28th, 32,675 had. Case rates in prisons have also increased drastically in Arizona and West Virginia. The highest case rate in the state prison systems remains in Michigan with 24,049 of its incarcerated population (651.54 per 1,000) having tested positive for COVID. Over half of the state’s prison population has tested positive for COVID in Alaska, Arkansas, Kansas, Michigan, and South Dakota.
Importantly, states have varying testing strategies within prisons and for their general population, indicating that these rates likely reflect a falsely low disease incidence with some states’ rates being more accurate than others.