Blog

States Halt COVID Data Publication

Written by Jennifer Lao and Forrest Behne || Last Updated November 2, 2021

The data collected by the COVID Prison Project comes primarily from publicly available information generated by departments of correction. For much of the pandemic, these data were available on COVID dashboards or otherwise collated from reports on departmental websites. That is no longer the case in many systems.  

The following departments of correction have decreased the frequency of reports, reduced the amount and variety of data provided, or ceased publication of COVID data outright. States in bold represent systems from which no current data is available.

  • Florida – stopped reporting new data on 6/2 
  • Georgia – stopped reporting on 7/19 
  • Louisiana – stopped reporting all but current positive cases  
  • Massachusetts – stopped reporting on 8/15
    • However, ACLU of Massachusetts released updated population totals on 9/15.
  • Mississippi – stopped reporting on 7/8
  • New Jersey – last daily update provided on 5/26 and last update on any data occurred on 6/18  
  • Puerto Rico – stopped reporting in December 2020
  • Oklahoma – stopped reporting any staff data on 8/3

Some systems have summarily cancelled data releases, while others are engaged in a draw-down of publication efforts. Massachusetts, for instance, published a “snapshot report” on July 15th and released only one more dataset on August 15th. The change, owing to a Massachusetts Supreme Judicial Court order, requires only the distribution of the total corrections population and the number of “actively COVID-19 positive” individuals.   

New York Times, July 15, 2021

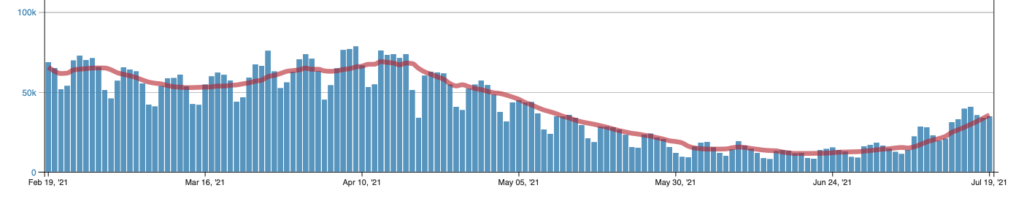
Daily trends in COVID-19 cases in the United States reported to CDC and 7-day moving average (CDC)

Departments of correction have sufficiently demonstrated the capability of generating and publishing public health information over the past year. These data are vital to efforts to mitigate the spread of a deadly, communicable disease both within the correctional ecosystem and in the communities that surround them. As rates of infection, hospitalization, and death rise in many parts of the country, it is essential that public health efforts receive the fullest possible support from local, state, and federal governments. This begins by providing sufficient information on disease transmission and health outcomes.

Among the many challenges faced by criminal-justice stakeholders is that, during the pandemic, facility access by independent observers—such as attorneys, volunteers, and non-essential staff—has been necessarily limited. With restrictions on access still in place in many parts of the country, the onus remains on corrections officials to generate and distribute these and other data.

Vaccination Rates Among Employees in State Departments of Corrections

Due to the nature of confinement in congregate settings with its limited physical space, it is difficult for individuals to isolate or distance from one another. Exposure to COVID-19 in these settings are thus high and can affect both those who are incarcerated and staff members. Therefore, vaccinations are crucial in mitigating COVID-19 infections. Given that employees are in contact with both the general and incarcerated population, vaccinating staff members may also curb the spread of COVID-19 between these communities.

However, in many states, staff members have not been vaccinating at high rates. For example, in Alabama, 26% percent of staff have been vaccinated. In West Virginia, 49% of staff are vaccinated.

The percentages of vaccinated employees are also generally lower than the percentage of vaccinated incarcerated individuals. For instance, in California, 69% of staff are fully vaccinated compared to 80% of the incarcerated population. This is similar in Virginia where about 71% staff are vaccinated compared to 79% of incarcerated individuals as well as Tennessee where the rates of staff and incarcerated individuals vaccinated are 66% and 77% respectively.

System # of employees vaccinated # of employees% of employees vaccinated# of incarcerated individuals vaccinated# of incarcerated individuals1% of incarcerated individuals vaccinated
AL*8823,40025.912,09925,10548.2
CA**NR65,93469NR99,53680
TN***3,3335,04466.117,73322,99477.1
VA****4,29010,93170.525,025
31,548
79.3
WV*****1,7983,68748.7
2,861

4,501
63.6

Currently, there have been rapid increases in the number of positive COVID-19 cases among both staff and incarcerated individuals. Thus, it is even more important that more employees are being vaccinated to slow the spread of COVID-19.

*The AL DOC does not report the number of staff who have been vaccinated through a community provider. The total for # of employees was given in the ADOC glossary located here: http://www.doc.state.al.us/employment.

**CA does not display the total of employees vaccinated, but lists how many employees are vaccinated in each of their facilities. The percentage of vaccinated staff and incarcerated individuals are given by the DOC and are the percentages of fully vaccinated totals.

***TN’s staff population are pulled from their latest Annual Report: https://www.tn.gov/correction/statistics-and-information/annual-reports.html

****VA’s staff and incarcerated population are pulled from their latest Annual Report: https://vadoc.virginia.gov/general-public/agency-reports

*****WV’s totals are pulled from their latest testing reports: https://dhhr.wv.gov/COVID-19/Pages/Correctional-Facilities.aspx

1incarcerated population numbers were pulled from CPP’s larger database

An Analysis of Interim COVID-19 Vaccination Plans

*Note: This post is regularly updated with the most current information by Forrest Behne.

Each U.S. state is developing programs to plan and operationalize a vaccination response to COVID-19 within their jurisdiction based on the Centers for Disease Control and Prevention (CDC) COVID-19 Vaccination Program Interim Playbook for Jurisdiction Operations, released October 29, 2020. States were tasked with developing a vaccine plan that includes three phases, ordered from highest to lowest priority, and ensuring equitable access for CDC defined “critical populations,” including (1) critical infrastructure workforce, (2) people at increased risk for severe COVID-19 illness, (3) people at increased risk of acquiring or transmitting COVID-19, and (4) people with limited access to routine vaccination services. 

CPP analyzed each of these plans to identify in which phase incarcerated people are targeted for COVID-19 vaccination. Thirty-four (34) States/Territories have, so far, included incarcerated populations as part of their Phase 1 vaccine distribution; of these 34 States/Territories, three (3) have specifically prioritized incarcerated populations that are medically vulnerable to COVID-19. These states are Arizona, South Dakota, and Utah. Medically vulnerable populations include incarcerated people that are over the age of 65 or have two or more chronic conditions. Four (4) states include incarcerated populations as part of their Phase 2 vaccine distribution. Tennessee and Missouri designate incarcerated populations for vaccination in phase 3 while correctional staff are targeted for Phase 1. We have categorized Montana as Phase 1 but must note that they organized their prioritization categories as tiers, making their plan more difficult to discern. Thirteen (13) states did not explicitly identify how they would prioritize incarcerated populations in the distribution of vaccines.

The image below shows how states have categorized incarcerated people into various phases for vaccine distribution. This analysis and figure are being updated as revisions to the states’ final plans occur. Vaccination plans may not be reflective of actual distribution. See our COVID-19 Vaccine Doses page for further details.

Reported COVID Vaccinations by State: August 4, 2021

While we will continue to collect data on COVID-19 vaccinations within prison systems, this will be our final weekly blog post. There have been many calls to prioritize COVID-19 vaccinations among incarcerated populations and the Delta variant has caused numerous recent outbreaks and deaths. Yet, many systems still do not report vaccination information and the percent of each state’s vaccinated incarcerated population are not substantially changing over time. 

As of August 4, 2021, 30 states (AK, AL, AZ, CA, CO, CT, DE, GA, ID, KS, MA, MD, ME, MN, MO, NC, ND, NH, NJ, NM, OH, OR, PA, SC, TN, UT, VA, WA, WI, WV) have reported vaccination numbers for their incarcerated population. No additional states have begun reporting data recently. Among states reporting data, 59% of the general population has received at least one dose of a COVID-19 vaccine and 67% of incarcerated populations have received at least one dose of a COVID-19 vaccine. However, these percentages vary drastically by state. The percent of the population that has received at least one vaccine in prisons ranges from 44% in AL to 85% in MN. In 4 of the states reporting data (CT, MA, NH, WA) the vaccination rate in the general population exceeds that of the prison population while in the other states, the vaccination rate in the prisons exceeds that of the general population. However, in some states where the vaccination of incarcerated populations exceeds that of the general population, vaccination of both populations remains low. Since our last report, CA has administered the most vaccinations within its prison system. NH has seen the largest percentage increase in vaccinations. However, 15 states have not reporting any increase in vaccinations in the past week. 

When available, we report the share of the total population that has received at least one vaccine dose. While an important public health metric, this does not equal the share that are fully vaccinated if the vaccine requires two doses. As states vary in the type of vaccines administered in prisons, the rate of the incarcerated population that is fully vaccinated varies across states. It is also possible that states’ rate of full vaccination varies between their general and incarcerated populations. Exceptions include AZ, CO, ME, SC, and WV. These states only report the number of incarcerated individuals that have been fully vaccinated, meaning it is possible that there are partially vaccinated individuals in these state systems. It is also possible that people recently entering state prison systems were vaccinated before being incarcerated and that their vaccinations would not be captured in these data. 

Another important aspect of vaccinations is the prioritization of vaccinations in prisons, which varies widely by state. However, as all adults are now eligible for COVID-19 vaccinations in the United States, vaccines should be available for all incarcerated persons despite their state’s prioritization of them.

As COVID-19 spreads particularly rapidly in congregate settings, it is crucial that all incarcerated persons are offered the COVID-19 vaccine. Critically, herd immunity is based on how contagious a disease is, making it likely that the relationship between COVID-19 vaccination rates and slowing case rates looks differently in carceral settings than in the general population with more incarcerated persons needing to be vaccinated to slow the spread. It is also important that these data are transparently reported on public systems. It is only through these data that we can comprehensively understand the progress of the COVID-19 pandemic and the role that vaccinations are playing within carceral settings. 

All data reported here comes from official dashboards reported by Departments of Correction. All data was pulled from state dashboards on August 4th. We do not publish data from the Federal Bureau of Prisons here as there is no relevant general population to compare the Federal Bureau of Prisons to. We have removed ORs data due to a lack of updated information but we still state them in the summary as reporting vaccinations. The COVID Prison Project also analyzes media reports to track vaccination plans for states that are not reporting public vaccination counts.

We have recently updated our population denominator data using Vera’s 2021 data release. Unfortunately, without individual level data, we are unable to confirm if all 100% of those that have passed through these states’ Departments of Corrections have received COVID-19 vaccinations. 

Reported COVID Vaccinations by State: July 26, 2021

There have been many continued calls to prioritize COVID-19 vaccinations among incarcerated populations given their high and disproportionate risk of COVID-19 infection and death. Additionally, all individuals age 12+ are now eligible for COVID-19 vaccinations in the United States and the highly contagious Delta variant is infecting unvaccinated people at an unprecedented speed. Despite this, not all systems are reporting vaccination data and states are vaccinating their incarceration at a slower rate than is necessary.

As of July 26, 2021, 30 states (AK, AL, AZ, CA, CO, CT, DE, GA, ID, KS, MA, MD, ME, MN, MO, NC, ND, NH, NJ, NM, OH, OR, PA, SC, TN, UT, VA, WA, WI, WV) have reported vaccination numbers for their incarcerated population. No additional states have begun reporting data in the past week. Among states reporting data, 58% of the general population has received at least one dose of a COVID-19 vaccine and 67% of incarcerated populations have received at least one dose of a COVID-19 vaccine. However, these percentages vary drastically by state. The percent of the population that has received at least one vaccine in prisons ranges from 44% in AL to 83% in MH. In 4 of the states reporting data (CT, MA, NH, WA) the vaccination rate in the general population exceeds that of the prison population while in the other states, the vaccination rate in the prisons exceeds that of the general population. However, in some states where the vaccination of incarcerated populations exceeds that of the general population, vaccination of both populations remains low. Since our last report, NC has administered the most vaccinations within its prison system. However, 16 states have not reporting any increase in vaccinations in the past week. 

When available, we report the share of the total population that has received at least one vaccine dose. While an important public health metric, this does not equal the share that are fully vaccinated if the vaccine requires two doses. As states vary in the type of vaccines administered in prisons, the rate of the incarcerated population that is fully vaccinated varies across states. It is also possible that states’ rate of full vaccination varies between their general and incarcerated populations. Exceptions include AZ, CO, ME, SC, and WV. These states only report the number of incarcerated individuals that have been fully vaccinated, meaning it is possible that there are partially vaccinated individuals in these state systems. It is also possible that people recently entering state prison systems were vaccinated before being incarcerated and that their vaccinations would not be captured in these data. 

Another important aspect of vaccinations is the prioritization of vaccinations in prisons, which varies widely by state. However, as all adults are now eligible for COVID-19 vaccinations in the United States, vaccines should be available for all incarcerated persons despite their state’s prioritization of them.

As COVID-19 spreads particularly rapidly in congregate settings, it is crucial that all incarcerated persons are offered the COVID-19 vaccine. Critically, herd immunity is based on how contagious a disease is, making it likely that the relationship between COVID-19 vaccination rates and slowing case rates looks differently in carceral settings than in the general population with more incarcerated persons needing to be vaccinated to slow the spread. It is also important that these data are transparently reported on public systems. It is only through these data that we can comprehensively understand the progress of the COVID-19 pandemic and the role that vaccinations are playing within carceral settings. 

All data reported here comes from official dashboards reported by Departments of Correction. All data was pulled from state dashboards on July 26th. We do not publish data from the Federal Bureau of Prisons here as there is no relevant general population to compare the Federal Bureau of Prisons to. We have removed ORs data due to a lack of recent updates but we still state them in the summary as reporting vaccinations. The COVID Prison Project also analyzes media reports to track vaccination plans for states that are not reporting public vaccination counts.

We have recently updated our population denominator data using Vera’s 2021 data release. Unfortunately, without individual level data, we are unable to confirm if all 100% of those that have passed through these states’ Departments of Corrections have received COVID-19 vaccinations. 

Reported COVID Vaccinations by State: July 20, 2021

There have been many continued calls to prioritize COVID-19 vaccinations among incarcerated populations given their high and disproportionate risk of COVID-19 infection and death. Additionally, all individuals age 12+ are now eligible for COVID-19 vaccinations in the United States and the highly contagious Delta variant is infecting unvaccinated people at an unprecedented speed. Despite this, not all systems are reporting vaccination data and states are vaccinating their incarceration at a slower rate than is necessary.

As of July 20, 2021, 30 states (AK, AL, AZ, CA, CO, CT, DE, GA, ID, KS, MA, MD, ME, MN, MO, NC, ND, NH, NJ, NM, OH, OR, PA, SC, TN, UT, VA, WA, WI, WV) have reported vaccination numbers for their incarcerated population. NM has recently begun reporting data. Among states reporting data, 57% of the general population has received at least one dose of a COVID-19 vaccine and 66% of incarcerated populations have received at least one dose of a COVID-19 vaccine. However, these percentages vary drastically by state. The percent of the population that has received at least one vaccine in prisons ranges from 44% in AL to 80% in ND. In 4 of the states reporting data (CT, DE, NH, WA) the vaccination rate in the general population exceeds that of the prison population while in the other states, the vaccination rate in the prisons exceeds that of the general population. However, in some states where the vaccination of incarcerated populations exceeds that of the general population, vaccination of both populations remains low. Since our last report, AZ has administered the most vaccinations within its prison system. However, 10 states have not reporting any increase in vaccinations recently. 

When available, we report the share of the total population that has received at least one vaccine dose. While an important public health metric, this does not equal the share that are fully vaccinated if the vaccine requires two doses. As states vary in the type of vaccines administered in prisons, the rate of the incarcerated population that is fully vaccinated varies across states. It is also possible that states’ rate of full vaccination varies between their general and incarcerated populations. Exceptions include AZ, CO, ME, SC, and WV. These states only report the number of incarcerated individuals that have been fully vaccinated, meaning it is possible that there are partially vaccinated individuals in these state systems. It is also possible that people recently entering state prison systems were vaccinated before being incarcerated and that their vaccinations would not be captured in these data. 

Another important aspect of vaccinations is the prioritization of vaccinations in prisons, which varies widely by state. However, as all adults are now eligible for COVID-19 vaccinations in the United States, vaccines should be available for all incarcerated persons despite their state’s prioritization of them.

As COVID-19 spreads particularly rapidly in congregate settings, it is crucial that all incarcerated persons are offered the COVID-19 vaccine. Critically, herd immunity is based on how contagious a disease is, making it likely that the relationship between COVID-19 vaccination rates and slowing case rates looks differently in carceral settings than in the general population with more incarcerated persons needing to be vaccinated to slow the spread. It is also important that these data are transparently reported on public systems. It is only through these data that we can comprehensively understand the progress of the COVID-19 pandemic and the role that vaccinations are playing within carceral settings. 

All data reported here comes from official dashboards reported by Departments of Correction. All data was pulled from state dashboards on July 20th. We do not publish data from the Federal Bureau of Prisons here as there is no relevant general population to compare the Federal Bureau of Prisons to. We have removed ORs data due to a lack of recent updates but we still state them in the summary as reporting vaccinations. The COVID Prison Project also analyzes media reports to track vaccination plans for states that are not reporting public vaccination counts.

We have recently updated our population denominator data using Vera’s 2021 data release. Unfortunately, without individual level data, we are unable to confirm if all 100% of those that have passed through these states’ Departments of Corrections have received COVID-19 vaccinations. 

Reported COVID Vaccinations by State: July 12, 2021

There have been many continued calls to prioritize COVID-19 vaccinations among incarcerated populations given their high and disproportionate risk of COVID-19 infection and death. Additionally, all individuals age 12+ are now eligible for COVID-19 vaccinations in the United States. Despite this, not all systems are reporting vaccination data and states are vaccinating their incarceration at a slower rate than is necessary.

As of July 12, 2021, 29 states (AK, AL, AZ, CA, CO, CT, DE, GA, ID, KS, MA, MD, ME, MN, MO, NC, ND, NH, NJ, OH, OR, PA, SC, TN, UT, VA, WA, WI, WV) have reported vaccination numbers for their incarcerated population. No new states have begun reporting data recently. Among states reporting data, 56% of the general population has received at least one dose of a COVID-19 vaccine and 66% of incarcerated populations have received at least one dose of a COVID-19 vaccine. However, these percentages vary drastically by state. The percent of the population that has received at least one vaccine in prisons ranges from 43% in AL to 80% in ND. In 4 of the states reporting data (CT, DE, NH, WA) the vaccination rate in the general population exceeds that of the prison population while in the other states, the vaccination rate in the prisons exceeds that of the general population. However, in some states where the vaccination of incarcerated populations exceeds that of the general population, vaccination of both populations remains low. Since our last report, OH has administered the most vaccinations within its prison system. However, six states have not reporting any increase in vaccinations recently. 

When available, we report the share of the total population that has received at least one vaccine dose. While an important public health metric, this does not equal the share that are fully vaccinated if the vaccine requires two doses. As states vary in the type of vaccines administered in prisons, the rate of the incarcerated population that is fully vaccinated varies across states. It is also possible that states’ rate of full vaccination varies between their general and incarcerated populations. Exceptions include AZ, CO, ME, SC, and WV. These states only report the number of incarcerated individuals that have been fully vaccinated, meaning it is possible that there are partially vaccinated individuals in these state systems. It is also possible that people recently entering state prison systems were vaccinated before being incarcerated and that their vaccinations would not be captured in these data. 

Another important aspect of vaccinations is the prioritization of vaccinations in prisons, which varies widely by state. However, as all adults are now eligible for COVID-19 vaccinations in the United States, vaccines should be available for all incarcerated persons despite their state’s prioritization of them.

As COVID-19 spreads particularly rapidly in congregate settings, it is crucial that all incarcerated persons are offered the COVID-19 vaccine. Critically, herd immunity is based on how contagious a disease is, making it likely that the relationship between COVID-19 vaccination rates and slowing case rates looks differently in carceral settings than in the general population with more incarcerated persons needing to be vaccinated to slow the spread. It is also important that these data are transparently reported on public systems. It is only through these data that we can comprehensively understand the progress of the COVID-19 pandemic and the role that vaccinations are playing within carceral settings. 

All data reported here comes from official dashboards reported by Departments of Correction. All data was pulled from state dashboards on July 12th. We do not publish data from the Federal Bureau of Prisons here as there is no relevant general population to compare the Federal Bureau of Prisons to. We have removed ORs data due to a lack of recent updates but we still state them in the summary as reporting vaccinations. The COVID Prison Project also analyzes media reports to track vaccination plans for states that are not reporting public vaccination counts.

We have recently updated our population denominator data using Vera’s 2021 data release. Unfortunately, without individual level data, we are unable to confirm if all 100% of those that have passed through these states’ Departments of Corrections have received COVID-19 vaccinations. 

Reported COVID Vaccinations by State: June 30, 2021

There have been many continued calls to prioritize COVID-19 vaccinations among incarcerated populations given their high and disproportionate risk of COVID-19 infection and death. Additionally, all individuals age 12+ are now eligible for COVID-19 vaccinations in the United States. Despite this, not all systems are reporting vaccination data and states are vaccinating their incarceration at a slower rate than is necessary.

As of June 30, 2021, 29 states (AK, AL, AZ, CA, CO, CT, DE, GA, ID, KS, MA, MD, ME, MN, MO, NC, ND, NH, NJ, OH, OR, PA, SC, TN, UT, VA, WA, WI, WV) have reported vaccination numbers for their incarcerated population. No new states have begun reporting data recently. Among states reporting data, 55% of the general population has received at least one dose of a COVID-19 vaccine and 65% of incarcerated populations have received at least one dose of a COVID-19 vaccine. However, these percentages vary drastically by state. The percent of the population that has received at least one vaccine in prisons ranges from 43% in AL to 78% in ND. In 3 of the states reporting data (CT, NH, WA) the vaccination rate in the general population exceeds that of the prison population while in the other states, the vaccination rate in the prisons exceeds that of the general population. However, in some states where the vaccination of incarcerated populations exceeds that of the general population, vaccination of both populations remains low. Since our last report, GA has administered the most vaccinations within its prison system. However, six states have not reporting any increase in vaccinations recently.

We report the share of the total population that has received at least one vaccine dose. While an important public health metric, this does not equal the share that are fully vaccinated if the vaccine requires two doses. As states vary in the type of vaccines administered in prisons, the rate of the incarcerated population that is fully vaccinated varies across states. It is also possible that states’ rate of full vaccination varies between their general and incarcerated populations. The one exception is AZ, which is reporting those that are fully vaccinated. Thus, while 26,000 are fully vaccinated, it is possible that more incarcerated individuals have received the first dose of their vaccine.

Another important aspect of vaccinations is the prioritization of vaccinations in prisons, which varies widely by state. However, as all adults are now eligible for COVID-19 vaccinations in the United States, vaccines should be available for all incarcerated persons despite their state’s prioritization of them.

As COVID-19 spreads particularly rapidly in congregate settings, it is crucial that all incarcerated persons are offered the COVID-19 vaccine. Critically, herd immunity is based on how contagious a disease is, making it likely that the relationship between COVID-19 vaccination rates and slowing case rates looks differently in carceral settings than in the general population with more incarcerated persons needing to be vaccinated to slow the spread. It is also important that these data are transparently reported on public systems. It is only through these data that we can comprehensively understand the progress of the COVID-19 pandemic and the role that vaccinations are playing within carceral settings.

All data reported here comes from official dashboards reported by Departments of Correction. All data was pulled from state dashboards on June 30th. We do not publish data from the Federal Bureau of Prisons here as there is no relevant general population to compare the Federal Bureau of Prisons to. We have recently begun reporting data on states (ME, UT) only sharing percent vaccinated rather than raw numbers. UT reported that as of May 20th, 58% of those incarcerated had received at least one dose and as of this week, 70% at one of the two state prisons had received at least one dose. This is why our visual shows a range. We have now begun reporting ME’s number as a percentage rather than a raw number, as the state recently changed its reporting. While ME was originally reporting a number vaccinated higher than their current incarcerated population total, the percentage reported now is 76%. We have removed ORs data due to a lack of recent updates and added back in NH’s data due to their recent updates. We have corrected an error in AK’s data and we now report that 66% of those incarcerated have received at lease one dose of the vaccine. The COVID Prison Project also analyzes media reports to track vaccination plans for states that are not reporting public vaccination counts.

We have recently updated our population denominator data using Vera’s 2021 data release. Unfortunately, without individual level data, we are unable to confirm if all 100% of those that have passed through these states’ Departments of Corrections have received COVID-19 vaccinations.

Reported COVID Vaccinations by State: June 18, 2021

There have been many continued calls to prioritize COVID-19 vaccinations among incarcerated populations given their high and disproportionate risk of COVID-19 infection and death. Additionally, all individuals age 12+ are now eligible for COVID-19 vaccinations in the United States. Despite this, few systems are reporting vaccination data and the majority of systems reporting data have vaccinated their incarcerated population at a lower rate than the general population.

As of June 18, 2021, 29 states (AK, AL, AZ, CA, CO, CT, DE, GA, ID, KS, MA, MD, ME, MN, MO, NC, ND, NH, NJ, OH, OR, PA, SC, TN, UT, VA, WA, WI, WV) have reported vaccination numbers for their incarcerated population. We have recently added OR’s data. Among states reporting data, 54% of the general population has received at least one dose of a COVID-19 vaccine and 65% of incarcerated populations have received at least one dose of a COVID-19 vaccine. However, these percentages vary drastically by state. The percent of the population that has received at least one vaccine in prisons ranges from 43% in AL to 100% in ME. In 3 of the states reporting data (CT, DE, WA) the vaccination rate in the general population exceeds that of the prison population while in the other states, the vaccination rate in the prisons exceeds that of the general population. However, in some states where the vaccination of incarcerated populations exceeds that of the general population, vaccination of both populations remains low. In the past week, MN has administered the most vaccinations within its prison system followed by CA, VA, and MO. However, six states have not reporting any increase in vaccinations this past week.

We report the share of the total population that has received at least one vaccine dose. While an important public health metric, this does not equal the share that are fully vaccinated if the vaccine requires two doses. As states vary in the type of vaccines administered in prisons, the rate of the incarcerated population that is fully vaccinated varies across states. It is also possible that states’ rate of full vaccination varies between their general and incarcerated populations. The one exception is AZ, which is reporting those that are fully vaccinated. Thus, while 26,000 are fully vaccinated, it is possible that more incarcerated individuals have received the first dose of their vaccine.

Another important aspect of vaccinations is the prioritization of vaccinations in prisons, which varies widely by state. However, as all adults are now eligible for COVID-19 vaccinations in the United States, vaccines should be available for all incarcerated persons despite their state’s prioritization of them.

As COVID-19 spreads particularly rapidly in congregate settings, it is crucial that all incarcerated persons are offered the COVID-19 vaccine. Critically, herd immunity is based on how contagious a disease is, making it likely that the relationship between COVID-19 vaccination rates and slowing case rates looks differently in carceral settings than in the general population with more incarcerated persons needing to be vaccinated to slow the spread. It is also important that these data are transparently reported on public systems. It is only through these data that we can comprehensively understand the progress of the COVID-19 pandemic and the role that vaccinations are playing within carceral settings.

All data reported here comes from official dashboards reported by Departments of Correction. All data was pulled from state dashboards on June 18th. We do not publish data from the Federal Bureau of Prisons here as there is no relevant general population to compare the Federal Bureau of Prisons to. We have removed UT’s data as they stopped reporting raw vaccination numbers and only percentages and we have removed NH’s data as they stopped reporting on June 16th. Since last week, we have corrected an error where we were accidentally double-counting ID’s vaccination data. The COVID Prison Project also analyzes media reports to track vaccination plans for states that are not reporting public vaccination counts.

We have recently updated our population denominator data using Vera’s 2021 data release. In one state, ME, the state has vaccinated enough people that have since been released that it appears that over 100% of their population is vaccinated. We thus report these states’ totals as 100%, realizing that not all incarcerated individuals may not have actually received the vaccine. Unfortunately, without individual level data, we are unable to confirm if all 100% of those that have passed through these states’ Departments of Corrections have received COVID-19 vaccinations.