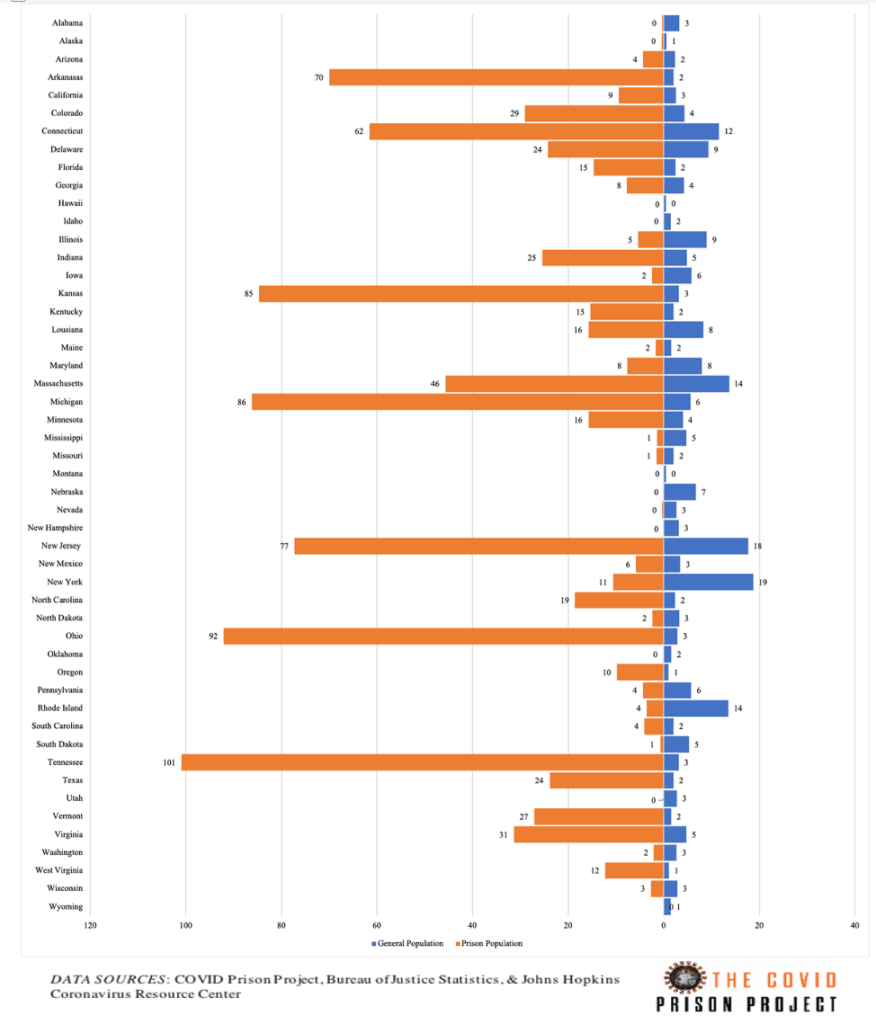
This graph shows the confirmed positive COVID-19 rate per 1,000 individuals in the prison population and the general population for each state as of May 27th, 2020. The left side of the graph (orange) refers to the prison population and the right side of the graph (blue) refers to the general population.
In the last two weeks, confirmed case rates in the prison population increased in nearly all states. The largest increase in the confirmed case rate among the prison population occurred in New Jersey where there was a 300% increase (from 19 per 1,000 to 77 per 1,000). Other states with large increases in the confirmed case rate among the prison population are Tennessee (increase of 40 per 1,000), Michigan (increase of 30 per 1,000), Connecticut (increase of 23 per 1,000), Texas and Kansas (increase of 13 per 1,000), and West Virginia (increase of 12 per 1,000). The states with the highest confirmed positive rate in the prison population are Tennessee, Ohio, Michigan, and Kansas.