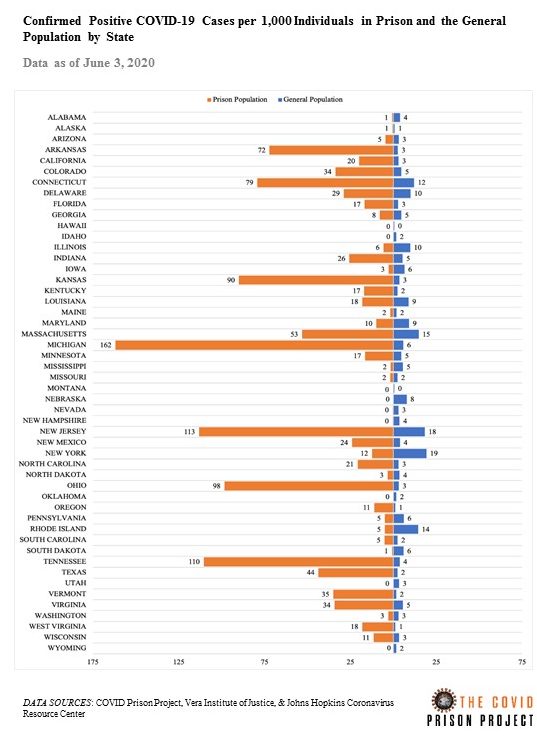
This graph shows the confirmed positive COVID-19 rate per 1,000 individuals in the prison population and the general population for each state as of June 3rd, 2020. The left side of the graph (orange) refers to the prison population and the right side of the graph (blue) refers to the general population. The rates calculated here use new state prison population data from the Vera Institute of Justice which better adjusts for COVID-19 related releases.
The confirmed positive COVID-19 case rate has increased in the prison population in more than half of states since last week, with the largest increases in Michigan (increase of 76 per 1,000), New Jersey (increase of 36 per 1,000), and Texas (increase of 20 per 1,000).
The confirmed case rate in the prison population is now above 100 in three states (Michigan, New Jersey, and Tennessee) and approaching 100 in two more (Ohio and Kansas). In fact, the confirmed COVID-19 case rate is around 30x greater in the prison population than the general population in the states of Ohio, Tennessee, and Michigan.