Covid Prison Hotspots

This week 22 out of 53 prisons systems are classified as Covid Prison Hotspots. This is our fourth posting.

We were inspired by the Kaiser Family Foundation‘s characterization of states as “covid hotspots” based on recent changes in cases and test positivity for the general population. So we applied their analysis to prison systems! For each prison system (50 states, FBOP, ICE, and Puerto Rico), we calculated the 14-day percent change in covid cases, the 14-day percent change in test positivity (i.e., the percent of tests that return positive), and the 7-day “rolling” average for test positivity, all for incarcerated people (not staff). If a prison system reports a 5% or greater increase in covid cases over the two week period AND reports a 1% or greater increase in test positivity over the two week period OR reports an average test positivity of 10% or higher, then they are classified as a Covid Prison Hotspot.

Covid Prison Hotspots

This week 23 out of 53 prisons systems are classified as Covid Prison Hotspots. This is our fourth posting.

We were inspired by the Kaiser Family Foundation‘s characterization of states as “covid hotspots” based on recent changes in cases and test positivity for the general population. So we applied their analysis to prison systems! For each prison system (50 states, FBOP, ICE, and Puerto Rico), we calculated the 14-day percent change in covid cases, the 14-day percent change in test positivity (i.e., the percent of tests that return positive), and the 7-day “rolling” average for test positivity, all for incarcerated people (not staff). If a prison system reports a 5% or greater increase in covid cases over the two week period AND reports a 1% or greater increase in test positivity over the two week period OR reports an average test positivity of 10% or higher, then they are classified as a Covid Prison Hotspot.

Covid Prison Hotspots

This week 22 out of 53 prisons systems are classified as Covid Prison Hotspots. This is our fourth posting.

We were inspired by the Kaiser Family Foundation‘s characterization of states as “covid hotspots” based on recent changes in cases and test positivity for the general population. So we applied their analysis to prison systems! For each prison system (50 states, FBOP, ICE, and Puerto Rico), we calculated the 14-day percent change in covid cases, the 14-day percent change in test positivity (i.e., the percent of tests that return positive), and the 7-day “rolling” average for test positivity, all for incarcerated people (not staff). If a prison system reports a 5% or greater increase in covid cases over the two week period AND reports a 1% or greater increase in test positivity over the two week period OR reports an average test positivity of 10% or higher, then they are classified as a Covid Prison Hotspot.

Covid Prison Hotspots

This week 21 out of 53 prisons systems are classified as Covid Prison Hotspots. This is our fourth posting.

We were inspired by the Kaiser Family Foundation‘s characterization of states as “covid hotspots” based on recent changes in cases and test positivity for the general population. So we applied their analysis to prison systems! For each prison system (50 states, FBOP, ICE, and Puerto Rico), we calculated the 14-day percent change in covid cases, the 14-day percent change in test positivity (i.e., the percent of tests that return positive), and the 7-day “rolling” average for test positivity, all for incarcerated people (not staff). If a prison system reports a 5% or greater increase in covid cases over the two week period AND reports a 1% or greater increase in test positivity over the two week period OR reports an average test positivity of 10% or higher, then they are classified as a Covid Prison Hotspot.

Covid Prison Hotspots

This week 23 out of 53 prisons systems are classified as Covid Prison Hotspots.

We were inspired by the Kaiser Family Foundation‘s characterization of states as “covid hotspots” based on recent changes in cases and test positivity for the general population. So we applied their analysis to prison systems! For each prison system (50 states, FBOP, ICE, and Puerto Rico), we calculated the 14-day percent change in covid cases, the 14-day percent change in test positivity (i.e., the percent of tests that return positive), and the 7-day “rolling” average for test positivity, all for incarcerated people (not staff). If a prison system reports a 5% or greater increase in covid cases over the two week period AND reports a 1% or greater increase in test positivity over the two week period OR reports an average test positivity of 10% or higher, then they are classified as a Covid Prison Hotspot.

Covid Prison Hotspots

This week 21 out of 53 prisons systems are classified as Covid Prison Hotspots.

We were inspired by the Kaiser Family Foundation‘s characterization of states as “covid hotspots” based on recent changes in cases and test positivity for the general population. So we applied their analysis to prison systems! For each prison system (50 states, FBOP, ICE, and Puerto Rico), we calculated the 14-day percent change in covid cases, the 14-day percent change in test positivity (i.e., the percent of tests that return positive), and the 7-day “rolling” average for test positivity, all for incarcerated people (not staff). If a prison system reports a 5% or greater increase in covid cases over the two week period AND reports a 1% or greater increase in test positivity over the two week period OR reports an average test positivity of 10% or higher, then they are classified as a Covid Prison Hotspot.

Covid Prison Hotspots

We have a new infographic to share with you!

We were inspired by the Kaiser Family Foundation‘s characterization of states as “covid hotspots” based on recent changes in cases and test positivity for the general population. So we applied their analysis to prison systems! For each prison system (50 states, FBOP, ICE, and Puerto Rico), we calculated the 14-day percent change in covid cases, the 14-day percent change in test positivity (i.e., the percent of tests that return positive), and the 7-day “rolling” average for test positivity, all for incarcerated people (not staff). If a prison system reports a 5% or greater increase in covid cases over the two week period AND reports a 5% or greater increase in test positivity over the two week period OR reports an average test positivity of 10% or higher, then they are classified as a Covid Prison Hotspot.

Editors note: As of today, it looks like KFF changed their criteria slightly, we will consider this for next weeks posting.

COVID Testing within Prisons

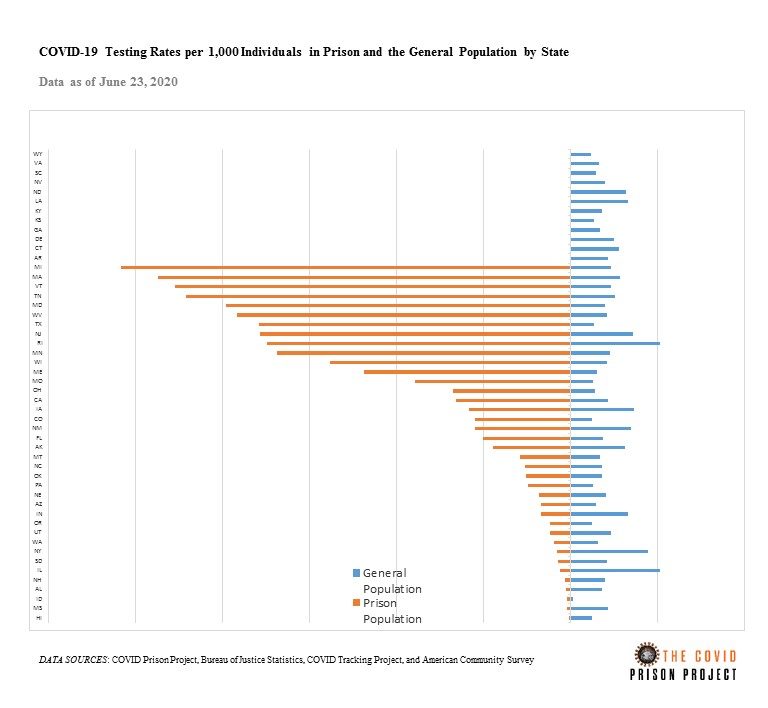
As of June 23rd, 12 states have yet to report any testing information within their correctional institutions. These data are critical for understanding the prevalence of COVID. For instance, if states are testing very few inmates, we cannot know the true prevalence of COVID within these facilities.

At the same time, many states have started mass testing, with Maryland, Massachusetts, Michigan, Minnesota, New Jersey, Rhode Island, Tennessee, Texas, Vermont, West Virginia, and Wisconsin having administered more than 500 COVID tests per 1,000 inmates. In these states, testing prevalence surpasses that of the general population. However, these states claim to have expanded testing to all inmates, which has yet to happen and has been slow to scale up. States that have experienced outbreaks, such as Ohio, have expanded mass testing in certain facilities but not systematically throughout the state, resulting in lower testing prevalence overall than their counterparts.

Many prison systems, even those that have not engaged in mass testing, have a testing prevalence per 1,000 that exceeds that of the general population. However, there remains a need to continue to increase testing given that communal living sites are the epicenter of the pandemic and multiple prisons across the country have experienced outbreaks. In particular, 11 prison systems that have released testing information are testing fewer inmates per 1,000 than their state is testing in their general population. For example, Hawaii has tested only 16 of its inmates, resulting in a testing prevalence of 3.76/1,000.

As the pandemic continues, there is a dire need to increase testing in correctional facilities, as it is the only way to detect cases and prevent further spread.

COVID-19 Test Transparency among Prison Systems

As we work to create accurate COVID case counts, it is critical to know the types of tests used by each prison system. Different tests have different information quality (i.e., how good they are at identifying those with COVID and without COVID) and have different types of information (i.e., detecting current COVID infection or those who have had COVID at any point). Both the quality and type of information are needed for us to know how accurate the data are and what story they tell.

From the information we have gleaned, we have various levels of detail. Fortunately, all prison systems we have heard from are using polymerise chain reaction (PCR) tests, which detect current infection rather than ever infection. PCR tests allow for more reliable information for individuals than antibody tests. While antibody tests help track the spread of COVID in a population, given the number of outbreaks in communal living settings, specifically in prisons, PCR tests are crucial. Beyond the fact that most prison systems are using PCR tests, additional information is scattered. Some states have been able to tell us the exact test brand and name (i.e., Georgia, Illinois, Maine), while others have said they don’t have more information than ‘nasal PCR swabs’ or generally ‘PCR tests.’ Still others have said that they work with too many labs to keep track or that they simply do not have the requested testing information.

In sum, 18 states have provided no information, 2 have said that this information is unavailable or unknown, 15 have provided us with some information (i.e., a PCR test is used), 5 states and both the BOP and ICE say they use multiple tests and labs, and 10 have provided full information including the type, name, and brand of test. Making testing information available that is both accurate and precise is critical as we and others track the spread of COVID in prisons. Without it, our information and knowledge is incomplete.

A Preliminary Analysis of Private Prison Facilities

Among the 53 prison systems that provide source data for the COVID Prison Project, 6 designate which of their facilities are public or private. We analyzed some of these data to get understand if there are differences in testing practices, and, subsequently, case rates in private and public facilities.

We found that private prisons have fallen behind their public counterparts in COVID testing and case detection. Among federal prisons, 6 out of the reported 11 private prisons are not reporting any COVID data (Big Spring FL, Big Spring, Dalby, Moshannon Valley, Reeves CI, Reeves DC). The five prisons reporting COVID data only report the number of inmates that have tested positive for COVID. As of June 8th, these private facilities have only reported a total of 72 positive cases and no testing information. This number has remained constant at 72 since reporting began on May 8th.

In Florida, private prisons have been slower to ramp up COVID testing than public facilities with three of the state’s five private prisons (Graceville, Lake City, Moore Haven) having tested fewer than 10 people who are incarcerated as of June 3, 2020. The state’s two private prisons that have detected COVID outbreaks are, unsurprisingly, the two that have tested over 1,200 inmates each (Gasden, South Bay). However, comparisons between Florida’s public and private facilities remain difficult, as certain private (South Bay) and public (Liberty) facilities that have detected COVID outbreaks are reporting a decreasing cumulative number of COVID tests, which technically should be impossible.

Among other states reporting testing data and information relevant to which facilities are private, Hawaii’s private prison has only tested three inmate and West Virginia one inmate as of June 8th. In Hawaii, though, testing numbers are low for all facilities (regardless of private vs. public designation).

While Georgia does not report the total number of tests, as of June 8th, no private facilities in Georgia had reported a change in the number of positive or recovered cases since May 4th whereas public facilities are reporting increasing numbers almost daily. In addition, Georgia’s private facilities are not reporting any staff information while the public facilities are.

We are able to glean more information from Arizona, where the total number of people in each facility is reported. As of June 3rd, private prisons have tested 0.68% of inmates whereas public prisons have tested 4.63%. Of those tested, private prisons have found 21% of inmates to be positive and public prisons have found 12% to be positive, indicating a dire need for further testing.

In summary, we are still learning more about private facilities, and while many states do not report which facilities are private, where information is available, private facilities are, in many cases, testing less, waiting longer to enact robust testing measures, and are reporting fewer cases even when reporting higher rates of test positivity.