COVID Case Watch June 3, 2020

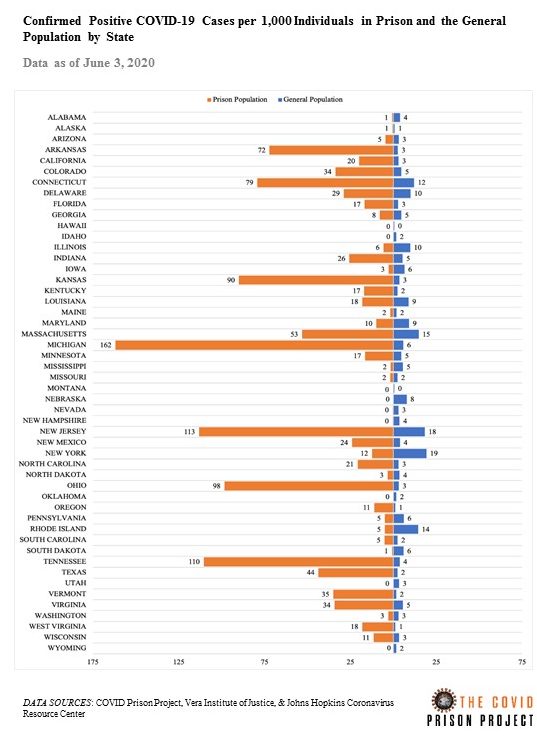
This graph shows the confirmed positive COVID-19 rate per 1,000 individuals in the prison population and the general population for each state as of June 3rd, 2020. The left side of the graph (orange) refers to the prison population and the right side of the graph (blue) refers to the general population. The rates calculated here use new state prison population data from the Vera Institute of Justice which better adjusts for COVID-19 related releases.

The confirmed positive COVID-19 case rate has increased in the prison population in more than half of states since last week, with the largest increases in Michigan (increase of 76 per 1,000), New Jersey (increase of 36 per 1,000), and Texas (increase of 20 per 1,000).

The confirmed case rate in the prison population is now above 100 in three states (Michigan, New Jersey, and Tennessee) and approaching 100 in two more (Ohio and Kansas). In fact, the confirmed COVID-19 case rate is around 30x greater in the prison population than the general population in the states of Ohio, Tennessee, and Michigan.

COVID-19 Case Watch: Preliminary Data from Jails

In counties with some of the largest jails, the COVID-19 infection rate in jails is between 3.5 and 73.1 times higher than the overall county infection rate. Cook County Jail has the highest infection rate; however, Bexar County has the largest disparity between the jail and the county overall. The infection rate in Bexar County Jail is 7.24%, which is 73.1 times higher than the 0.10% infection rate for Bexar County overall. Similar to prisons, infection rates in jails are dependent on testing. For example, Harris County Jail in Houston, TX has engaged in widespread testing.

Methods: While we are not systematically tracking COVID-19 cases in jails yet, we conducted this preliminary analysis. The raw data are provided in Table 1. The Vera Institute of Justice has been monitoring jail populations during COVID-19. We used their daily population counts for the denominator. The numerator data come from either government sources or media sources. The links for each report are provided in the table. The community infection rates are from The New York Times (data from May 11, 2020 8:10am ET).