testcontent123
Author: Kathryn Nowotny
More work necessary to build trust around vaccines among people who are incarcerated.
Written by Sarah Khorasani and Alysse Wurcel, MD MS, Tufts Medical Center, Department of Medicine
Criminal-legal involved populations, including people incarcerated in jail and prison, face a disproportionate burden of both chronic and infectious diseases. In particular, the conditions of confinement increase the transmission risks of respiratory infections like COVID-19 and influenza in carceral settings. Amid the ongoing COVID-19 vaccine distribution efforts, many reports have highlighted hesitation to get the vaccine, particularly among communities of color and people from lower-income communities.
In Massachusetts, people in congregate settings, including people incarcerated in jail, have been prioritized for COVID-19 vaccination. Although prioritization is a crucial and necessary step to vaccinating an already vulnerable population, we must acknowledge that offers of vaccination may not be universally accepted.
Influenza, which shares a transmission mechanism with COVID-19, is responsible for millions of illnesses and tens of thousands of deaths annually in the US despite the existence of effective vaccines. However, there has been limited research and policy related to influenza vaccinations in jails, and no research that we are aware of examines the acceptance of flu vaccines among people incarcerated in jails.
Our work in Massachusetts has identified heterogeneous flu-related policies and infrequent acceptance of influenza vaccines in jails. We gathered flu vaccine acceptance data from first-pass vaccination efforts in Massachusetts jails in the hope that these data would shed light on gaps in care that may impact health outcomes and delivery of the COVID-19 vaccine among people who are incarcerated.
Influenza vaccine acceptance rates among people incarcerated in Massachusetts jails, September-October 2020 (Total n=3246)
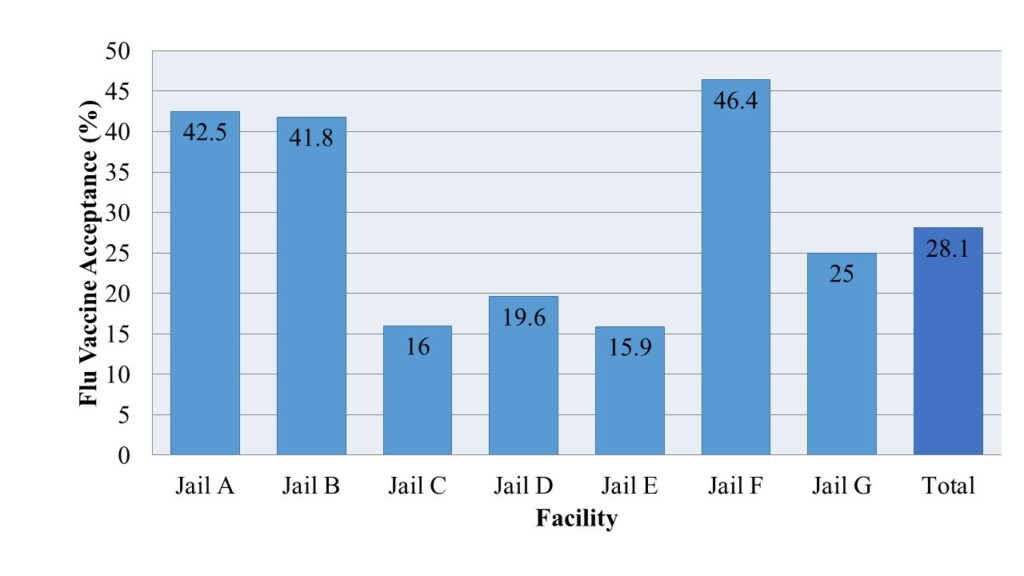
Of the fourteen jails in Massachusetts, seven responded to our request for information. Overall, the flu vaccine acceptance rate was 28.1%, ranging between 15.9% and 46.4% across facilities. Not all people experiencing incarceration in each facility were offered vaccines during initial vaccination efforts. Four of the seven facilities had an acceptance rate at or below 25% among over 2000 people offered vaccines. Two of the facilities with an acceptance rate over 40% offered the vaccine to fewer than 200 people, while the third facility offered the influenza vaccine to nearly 1000 individuals.
While prioritizing vaccination for infectious diseases among those experiencing incarceration is essential for improved outcomes and health equity, ensuring that people in carceral settings are vaccinated requires more than getting vaccines to correctional facilities.
Vaccine delivery to carceral settings is in itself a particular and under-studied challenge that bears careful examination as COVID-19 vaccine distribution efforts continue. During the H1N1 influenza pandemic in 2009-2010, a narrow majority of federal and state prisons received the vaccine though only 28% of jails did. Distribution of vaccinations to all carceral settings regardless of size and type must improve. Even with improved distribution mechanisms, however, the presence of vaccines means little if the people who need them do not want them.
Low vaccine acceptance is particularly likely in a population that has faced decades of exploitation by the criminal-legal and medical establishments and is often forgotten about in discussions of public health. The structure of the correctional system itself also serves to augment already incredible racial inequities. This is particularly meaningful given that studies on vaccine hesitancy, or the factors, behaviors, and attitudes related to the delay or refusal of vaccination, have noted marked racial differences in influenza vaccination rates and in reasons for avoiding vaccination. Communities of color regularly express more hesitancy than their white peers with reasons for vaccine hesitancy including perceived need for vaccine, perceived safety and efficacy of vaccines, and childhood experiences. Perceived racial fairness has also been associated with increased probability of vaccination among black adults.
COVID-19 has highlighted the unique risks and the significant health inequities experienced by people incarcerated in jails and prisons. The close quarters and limited movement allowed in carceral settings particularly restrict infection mitigation efforts. The spread of COVID-19 in carceral settings not only affects the health of those who are incarcerated but also the health of the surrounding communities. Vaccines offer a safe and cost-effective way to prevent many infectious diseases, including COVID-19 and influenza.
Correctional facilities are critical sites for preventive care including through safe and effective vaccines for influenza, but people incarcerated in Massachusetts jails during initial influenza vaccination efforts for the 2020-2021 influenza season were unlikely to accept vaccination. Though the data discussed here represent only a small subsection of correctional facilities and the populations they house, they are evidence that further work is necessary to identify barriers to vaccination. These data also indicate significant potential challenges in COVID-19 vaccination efforts.
We must prioritize and engage people experiencing incarceration to build trust in vaccination efforts with the ultimate goal of improving health outcomes and health equity. Further research into vaccine hesitancy both for influenza vaccines and for the COVID-19 vaccines in correctional settings will be essential to protect the health of our communities and their most vulnerable members.
Data Collection Update
We have changed how we are reporting testing and case rates on the Data by State page. Previously, we used the 2018 year end prison population numbers released April 30, 2020 from the Bureau of Justice Statistics for the denominator. Since these data are old, and there have been recent changes to prison populations, we are now using more recent population data collected by the Vera Institute of Justice. For all states, minus the exceptions below, the population data are for April 30/May 1, 2020. For the following states we use population data for March 31, 2020: Montana, South Dakota, Tennessee, and Washington. For the following states we use population data for December 31, 2019: Illinois, Maryland, Minnesota, Montana, New Mexico, and Virginia. These represent the most recent data available.
Our testing rates represent the number of tests per population. It is possible that some states are testing the same person more than once. Only one state is reporting the number of people tested separately from the number of tests given. As an example, Michigan has now reported more tests for COVID-19 (37,885) than there are people currently incarcerated in their prisons (36,980), likely due to releasing people from prison, widespread testing practices (including repeat testing), and deaths.
Last updated June 4, 2020.
COVID-19 Case Watch: Preliminary Data from Jails
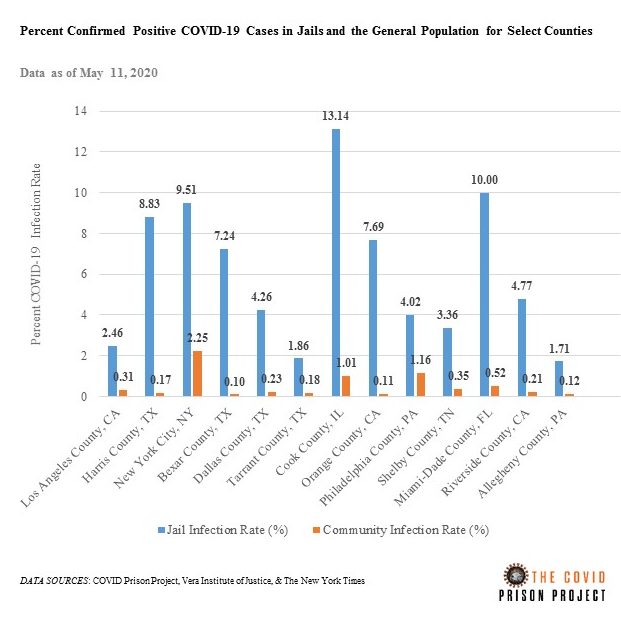
In counties with some of the largest jails, the COVID-19 infection rate in jails is between 3.5 and 73.1 times higher than the overall county infection rate. Cook County Jail has the highest infection rate; however, Bexar County has the largest disparity between the jail and the county overall. The infection rate in Bexar County Jail is 7.24%, which is 73.1 times higher than the 0.10% infection rate for Bexar County overall. Similar to prisons, infection rates in jails are dependent on testing. For example, Harris County Jail in Houston, TX has engaged in widespread testing.
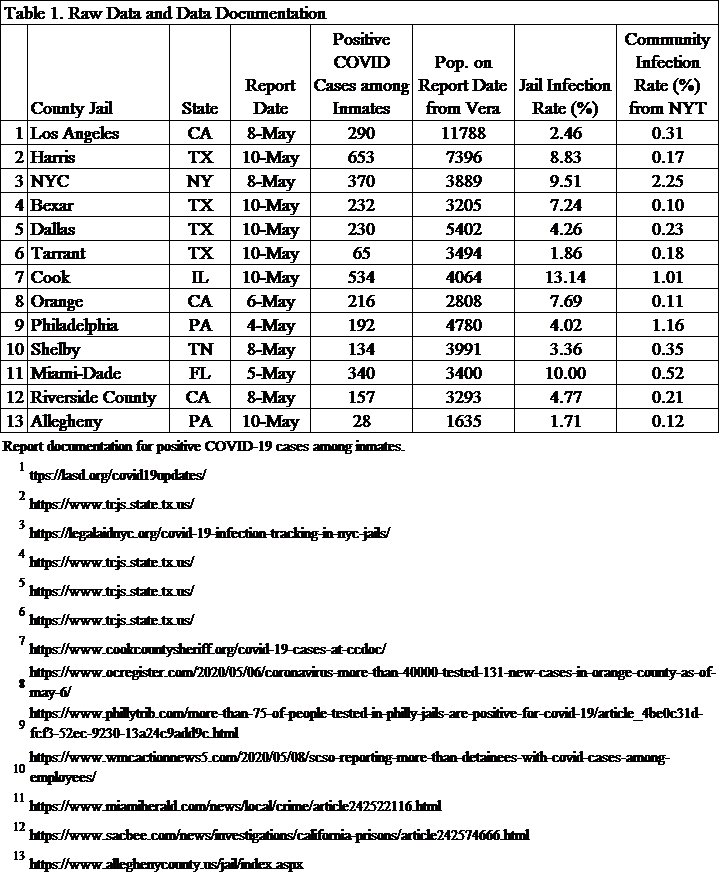
Methods: While we are not systematically tracking COVID-19 cases in jails yet, we conducted this preliminary analysis. The raw data are provided in Table 1. The Vera Institute of Justice has been monitoring jail populations during COVID-19. We used their daily population counts for the denominator. The numerator data come from either government sources or media sources. The links for each report are provided in the table. The community infection rates are from The New York Times (data from May 11, 2020 8:10am ET).
Data Collection Methods
In this blog post, we detail how we are collecting data and how our data may be different from other sources. If you still have questions after viewing this blog post, please contact us.
How are you collecting data?
We are collecting data manually. Every day of the week (Sun thru Sat) a team member checks the website for all 52 prison systems (50 states, Federal BOP, ICE). As of now, we are not including media reports, which may have more accurate and timely data. The links to the source websites where we are finding our data are posted on the state data page of our website.
We enter the data into a spreadsheet, aggregate it, and then post it to the website. There is one exception for the state of New Mexico. They have not yet started reporting their data regularly on their website. So, our staff called them on May 4 to ask for their data. The “last updated” date is not the date that the latest data was released by the institution but is the latest date that we checked for data on their website. Some systems are releasing data every day, some every business day, and some every few days. Because institutions sometimes change the way they report data, we check them all every day. We are working on automating this process using web scraping, but we will continue to check the data manually due to some caveats, which are outlined below.
What kind of data are you collecting?
We are collecting everything! If a system is reporting it, we are recording it. We are purposeful in the way that we aggregate data for public presentation. Every system is reporting data in different ways, so we had to make some decisions in order to standardize the data. For example, some systems are reporting confirmed COVID-19 deaths, suspected COVID-19 deaths, COVID-19 deaths pending autopsy, and or confirmed COVID-19 deaths with underlying causes. Some systems only report COVID-19 “deaths” without any further information. As of now, we aggregate all COVID-19 related deaths. As another example some department of corrections include probation and parole and report numbers of cases in that population too. We have intentionally decided to exclude those case counts in our totals for now. We are still collecting it, though, and will include these numbers later when we have more capacity to report publicly all the data we have collected. We are in the process of editing our data dictionary for public use and will post it soon. The data dictionary includes case definitions and all the data peculiarities for each institution.
What are the strengths and limitations of your data?
All data has strengths and limitations, and it is important to understand these when using data. We have been collecting data at the facility level for every state and the BOP every day since April 22. We have some data for some institutions prior to April 22, but it is not consistent. Since our data is collected manually, we are able to set criteria and exclude/include cases based on that criteria. We are also able to see when institutions change the way they are reporting data and correct it in our files. For example, some states changed their reporting of COVID-19 cases so that they are no longer cumulative. We have to use our historic data and the new data they present to make sure that we are presenting cumulative counts. These are some of the strengths of our data. However, relying on humans to do this work, rather than computers, also creates some limitations. Humans make typos and other errors. We do have some redundancy built into our process to catch errors as soon as possible.
How is your data different then other collections?
Each dataset on COVID-19 and corrections will have some differences. For example, the Marshall Project also collected data on COVID-19 and corrections. Their methodology was very different from ours, however. They called the institutions once a week to collect cumulative data over the phone. They also only collected data for a finite period of time, rather than continuously. It might be good practice to use multiple data sources to triangulate your findings. We too are working to see if there are ways for us to combine our data with the Marshall Project to make more robust the complete data picture here at the COVID Prison Project.
Last updated May 19, 2020.
Welcome!
This project was launched by a group of interdisciplinary scientists who work at the intersection of public health and criminal justice. We hope to fill a major gap in how COVID-19 in correctional settings is reported, tracked, and analyzed.
The risk posed by infectious diseases in prisons and jails is significantly higher than in the community, both in terms of risk of transmission, exposure, and harm to individuals who become infected. This is true of other group living facilities, such as nursing homes and assisted living facilities. In correctional facilities, risk is driven by close-quarter unsanitary living conditions and limited access to hygiene products. Moreover, people in prisons tend to have a higher burden of health conditions that may make them more susceptible to COVID-19, because they overwhelmingly come from our most marginalized neighborhoods.
Some jails and prisons have worked to change policy to release people and modify their policies on the inside to prevent disease transmission. Some have not. Regardless of these actions, many jails and prison across the country have become the epi-center of the COVID-19 pandemic in America, with outbreaks occurring in large urban jails (e.g. Riker’s Island, Cook County Jail) and prison facilities (in Ohio, North Carolina, Michigan and other states).
While we are reporting these data, it is important to keep in mind a few things. First, these data are preliminary. Just like reporting by departments of public health, it will likely be months (or years) before we have a complete set of valid data. Still, it is important to monitor these trends as they develop over time. Second, we caution against comparing the number of cases and the number of tests within departments of correction across states. States vary in the type of information they are reporting. The number of cases directly correlates to the number of tests, meaning that states that are doing more testing will have a higher number of positive cases. Testing guidelines for prisons are likely shaped by other state agencies (e.g., departments of public health). And, the inmate population size and correctional management strategies (e.g., inmate housing) vary by state. We think it is more useful to compare what is happening in prisons to what is happening in the community within their state. Third, it is important to keep in mind that there is a natural lag in reporting: from the time someone is tested, to when results are received, to when they are reported internally, and, finally, to when they are reported publicly. Our data come from the information that is publicly reported by departments of correction. The most common way that states are reporting information about prisons is through their website, but this is not always the case.
Over the coming weeks, we hope to grow our website and make it more interactive. So please check back often for new content. If you are a prison administrator, and you have more accurate data that you want to share with us, please contact us! We also welcome ideas and questions from viewers.