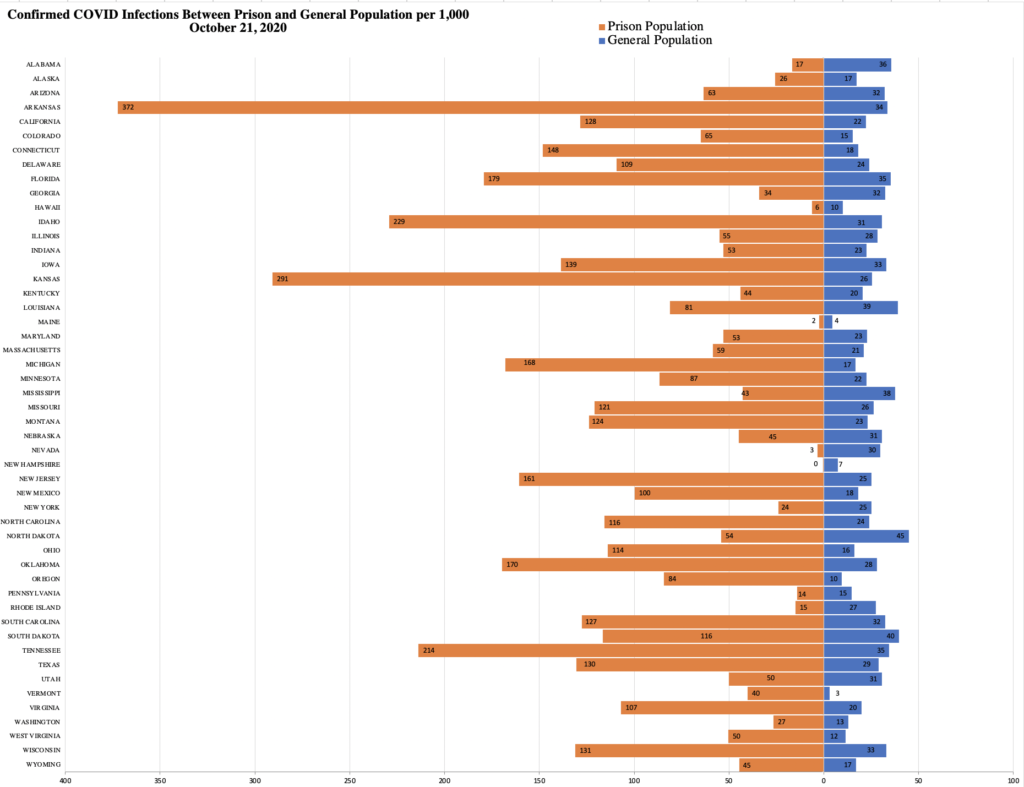
This graph shows confirmed positive cases of COVID-19 per 1,000 individuals in the prison and general populations in each state as of October 21, 2020. The left side (orange) refers to the prison population and the right side (blue) refers to the general population.
The rate of COVID in the general population is 25.06 per 1,000 individuals. In the prison population, the rate is 106.84 per 1,000 individuals. This means that, on average, the rate of COVID infections in prison populations is 4.26 times the rate of COVID infections in the general population. Arkansas, Kansas, and Vermont continue to have a prison infection rate that is over 10 times that of the general population. In 42 of the 50 US states, the rate of COVID infections among those imprisoned exceeds the rate of COVID infections among the general population.
Importantly, states have varying testing strategies within prisons and for their general population, indicating that these rates likely reflect a falsely low disease incidence with some states’ rates being more accurate than others.