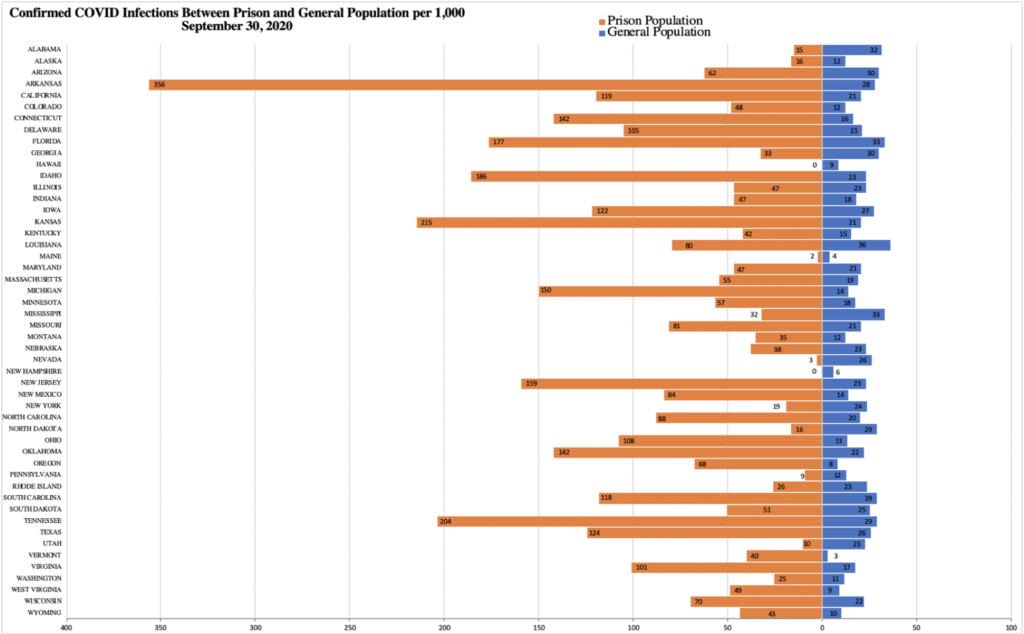
This graph shows confirmed positive cases of COVID-19 per 1,000 individuals in the prison and general populations in each state as of September 30, 2020. The left side (orange) refers to the prison population and the right side (blue) refers to the general population.
The rate of COVID in the general population is 21.78 per 1,000 individuals. In the prison population, the rate is 96.11 per 1,000 individuals. This means that, on average, the rate of COVID infections in prison populations is 4.41 times the rate of COVID infections in the general population. Arkansas, Kansas, Michigan, and Vermont all have a prison infection rate that is over 10 times that of the general population. In 40 of the 50 US states, the rate of COVID infections among those imprisoned exceeds the rate of COVID infections among the general population.
Since these rates were last calculated by our team on August 19th, the general population has experienced an increase in cases of 5.23 per 1,000 population whereas the prison population has experienced an increase in cases of 26.11 cases per 1,000 population.
Importantly, states have varying testing strategies within prisons and for their general population, indicating that these rates likely reflect a falsely low disease incidence with some states’ rates being more accurate than others.