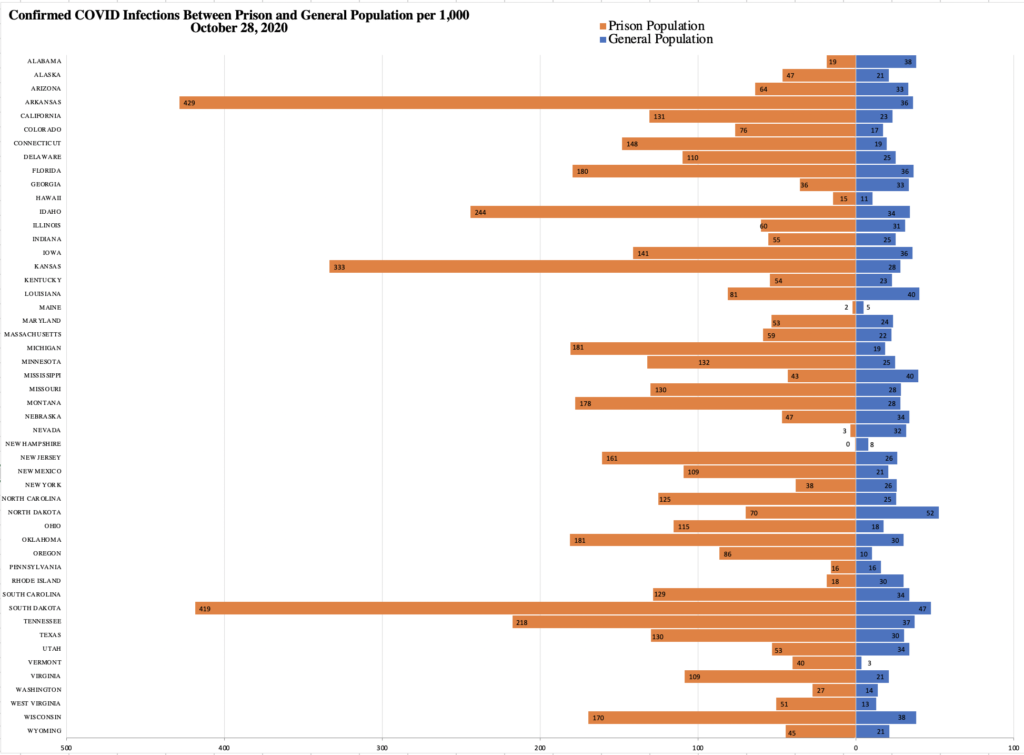
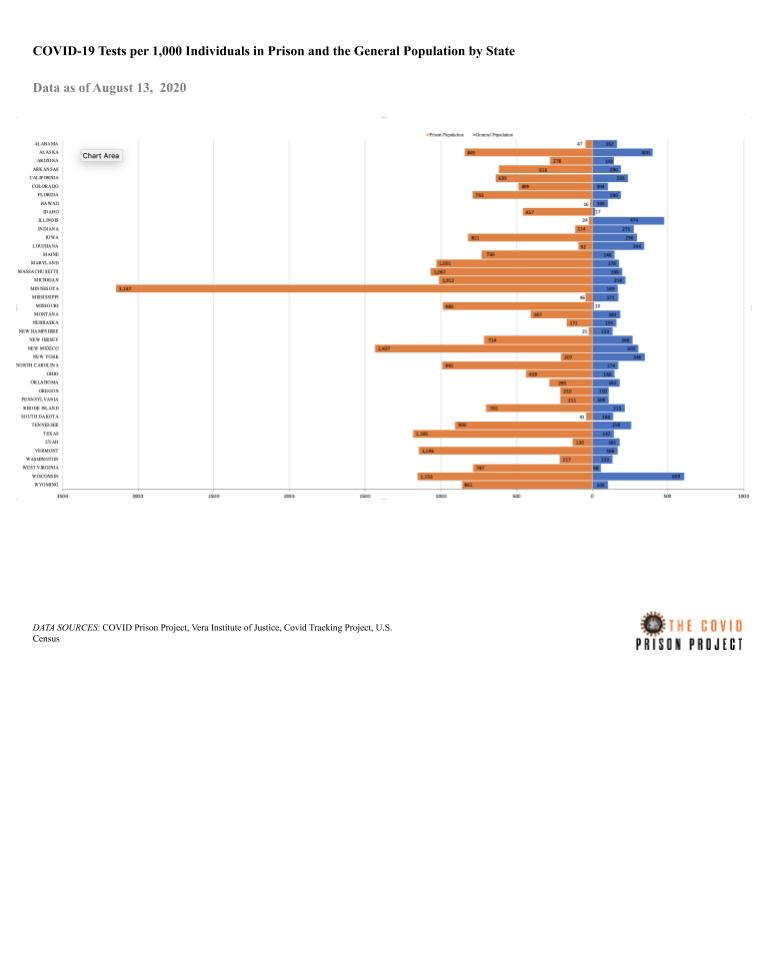
This graph shows confirmed positive cases of COVID-19 per 1,000 individuals in the prison and general populations in each state as of October 28, 2020. The left side (orange) refers to the prison population and the right side (blue) refers to the general population.
The rate of COVID in the general population is 26.61 per 1,000 individuals. In the prison population (in state prisons), the rate is 113.35 per 1,000 individuals. This means that, on average, the rate of COVID infections in prison populations is 4.26 times the rate of COVID infections in the general population. Arkansas, Kansas, and Vermont continue to have a prison infection rate that is over 10 times that of the general population.
Despite a surge of COVID cases in the general population this month, in 45 of the 50 US states, the rate of COVID infections among those imprisoned exceeds the rate of COVID infections among the general population. As cases have risen in the Midwest, the general population of Montana, North Dakota, South Dakota, and Wisconsin have seen an increase in case rates of 4.9-7.9 per 1,000 in the past week. However, the case rates in Midwestern prisons have increased much more. Montana, North Dakota, South Dakota, and Wisconsin prisons have seen an increase in case rates in the past week of 54 per 1,000, 16 per 1,000, 302 per 1,000, and 38 per 1,000, respectively.
Importantly, states have varying testing strategies within prisons and for their general population, indicating that these rates likely reflect a falsely low disease incidence with some states’ rates being more accurate than others.