*Note: This post is regularly updated with the most current information by Forrest Behne.
Each U.S. state is developing programs to plan and operationalize a vaccination response to COVID-19 within their jurisdiction based on the Centers for Disease Control and Prevention (CDC) COVID-19 Vaccination Program Interim Playbook for Jurisdiction Operations, released October 29, 2020. States were tasked with developing a vaccine plan that includes three phases, ordered from highest to lowest priority, and ensuring equitable access for CDC defined “critical populations,” including (1) critical infrastructure workforce, (2) people at increased risk for severe COVID-19 illness, (3) people at increased risk of acquiring or transmitting COVID-19, and (4) people with limited access to routine vaccination services.
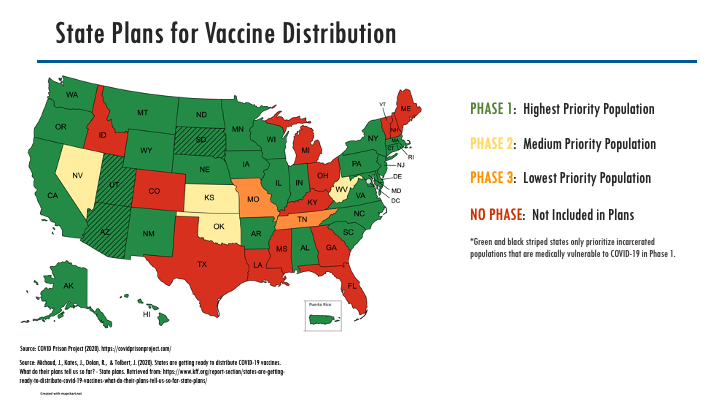
CPP analyzed each of these plans to identify in which phase incarcerated people are targeted for COVID-19 vaccination. Thirty-four (34) States/Territories have, so far, included incarcerated populations as part of their Phase 1 vaccine distribution; of these 34 States/Territories, three (3) have specifically prioritized incarcerated populations that are medically vulnerable to COVID-19. These states are Arizona, South Dakota, and Utah. Medically vulnerable populations include incarcerated people that are over the age of 65 or have two or more chronic conditions. Four (4) states include incarcerated populations as part of their Phase 2 vaccine distribution. Tennessee and Missouri designate incarcerated populations for vaccination in phase 3 while correctional staff are targeted for Phase 1. We have categorized Montana as Phase 1 but must note that they organized their prioritization categories as tiers, making their plan more difficult to discern. Thirteen (13) states did not explicitly identify how they would prioritize incarcerated populations in the distribution of vaccines.
The image below shows how states have categorized incarcerated people into various phases for vaccine distribution. This analysis and figure are being updated as revisions to the states’ final plans occur. Vaccination plans may not be reflective of actual distribution. See our COVID-19 Vaccine Doses page for further details.
