COVID Case Watch December 10, 2020

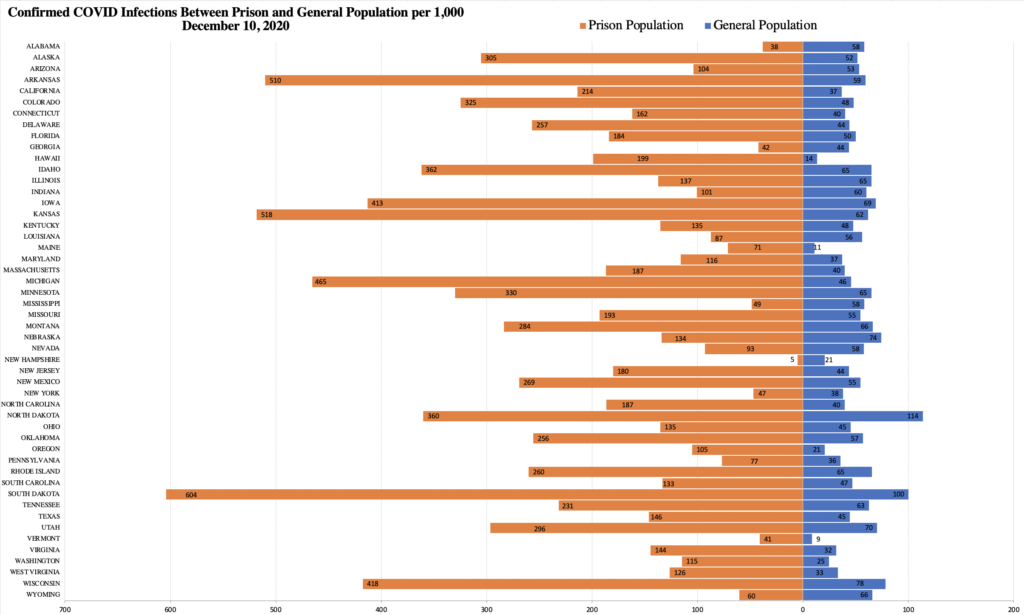
This graph shows confirmed positive cases of COVID-19 per 1,000 individuals in the prison and general populations in each state as of December 10, 2020. The left side (orange) refers to the prison population and the right side (blue) refers to the general population. 

The rate of COVID in the general population is 46.61 per 1,000 individuals. In the prison population, the rate is 176.33 per 1,000 individuals. On average, the rate of COVID infections in prison populations remains almost four times the rate of COVID infections in the general population. Hawaii and Michigan have prison infection rates that are over 10 times that of the state general population. 

Despite the recent surge of COVID cases in the general population in the last two months, in 45 of the 50 US states, the rate of COVID infections among those imprisoned still exceeds the rate of COVID infections among the general population. In the last two weeks, case rates have continued to increase drastically in prisons in multiple states. The largest increase in prison population cases this past week has occurred in Rhode Island. Last week, 283 of the state’s 2,395 incarcerated population had tested positive. By this week, 623 had tested positive. Case rates in prisons have also increased drastically in Alaska, Colorado, Delaware, Idaho, Michigan, Utah, and Washington. The highest case rate in the state prison systems remains in South Dakota with 2,292 of its incarcerated population (604.11 per 1,000) having tested positive for COVID. 

Importantly, states have varying testing strategies within prisons and for their general population, indicating that these rates likely reflect a falsely low disease incidence with some states’ rates being more accurate than others.
COVID Case Watch December 2, 2020

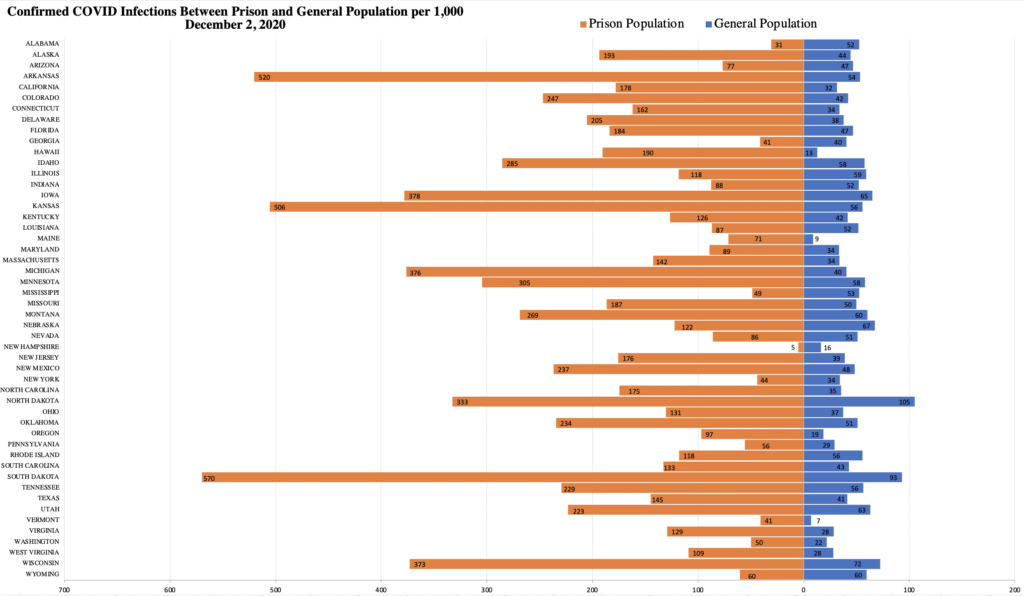
This graph shows confirmed positive cases of COVID-19 per 1,000 individuals in the prison and general populations in each state as of December 2, 2020. The left side (orange) refers to the prison population and the right side (blue) refers to the general population. 

The rate of COVID in the general population is 41.60 per 1,000 individuals. In the prison population, the rate is 158.50 per 1,000 individuals. This means that, on average, the rate of COVID infections in prison populations remains almost four times the rate of COVID infections in the general population. Hawaii has a prison infection rate that is over 10 times that of the general population. 

Despite the recent surge of COVID cases in the general population in the last two months, in 47 of the 50 US states, the rate of COVID infections among those imprisoned still exceeds the rate of COVID infections among the general population. In the last two weeks, case rates have continued to increase drastically in prisons in multiple states. The largest increase in prison population cases this past two weeks has occurred in Alaska. Two weeks ago, 399 of the state’s 3,985 incarcerated population had tested positive. By this week, 771 had tested positive. Case rates in prisons have also increased drastically in Colorado, Delaware, Hawaii, Michigan, Missouri, Rhode Island, and Wisconsin. The highest case rate in the state prison systems remains in South Dakota with 2,161 of its incarcerated population (569.58 per 1,000) having tested positive for COVID. 

Importantly, states have varying testing strategies within prisons and for their general population, indicating that these rates likely reflect a falsely low disease incidence with some states’ rates being more accurate than others.
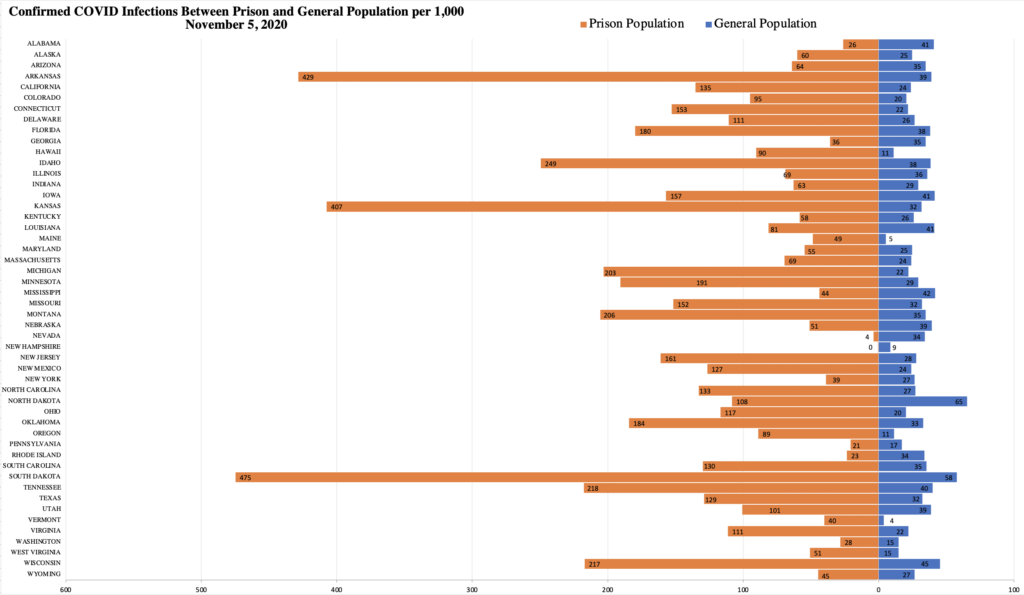
COVID Case Watch November 19, 2020

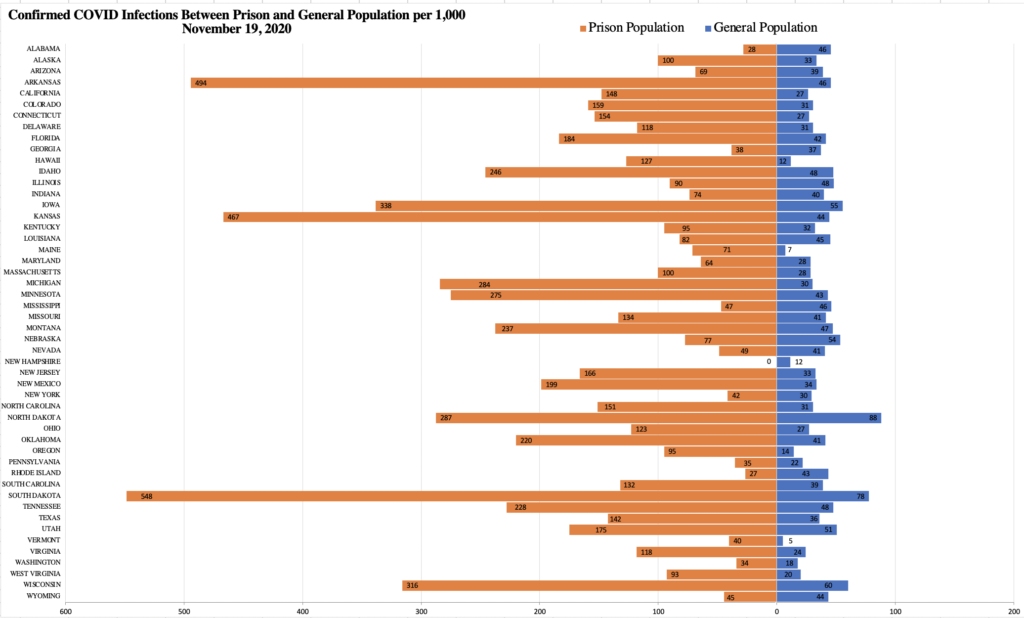
This graph shows confirmed positive cases of COVID-19 per 1,000 individuals in the prison and general populations in each state as of November 19, 2020. The left side (orange) refers to the prison population and the right side (blue) refers to the general population. 

The rate of COVID in the general population is 34.51 per 1,000 individuals. In the prison population, the rate is 138.97 per 1,000 individuals. This means that, on average, the rate of COVID infections in prison populations remains over four times the rate of COVID infections in the general population. Arkansas, Hawaii, Kansas, and Maine have a prison infection rate that is over 10 times that of the general population. 

Despite the recent surge of COVID cases in the general population this month, in 47 of the 50 US states, the rate of COVID infections among those imprisoned exceeds the rate of COVID infections among the general population. In the last week, case rates have continued to increase drastically in prisons in multiple states. The largest increase in both the general and prison population cases this past week has occurred in North Dakota, emphasizing that COVID spreads quickly from communities to prisons. Last week, 190 of the state’s 1,461 incarcerated population had tested positive. By this week, 420 had tested positive. Case rates in prisons have also increased drastically in Colorado, Iowa, Kansas, Michigan, Minnesota, and Wisconsin. The highest case rate in the state prison systems remains in South Dakota with 2,081 of its incarcerated population (548.50 per 1,000) having tested positive for COVID. 

Importantly, states have varying testing strategies within prisons and for their general population, indicating that these rates likely reflect a falsely low disease incidence with some states’ rates being more accurate than others.
COVID Case Watch November 12, 2020

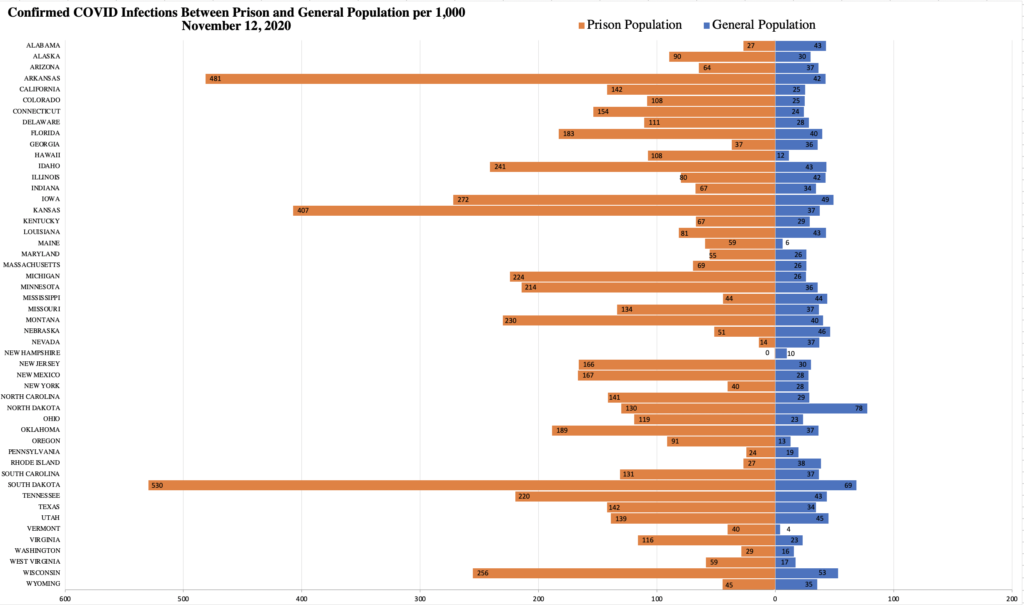
This graph shows confirmed positive cases of COVID-19 per 1,000 individuals in the prison and general populations in each state as of November 12, 2020. The left side (orange) refers to the prison population and the right side (blue) refers to the general population. 

The rate of COVID in the general population is 31.60 per 1,000 individuals. In the prison population, the rate is 127.93 per 1,000 individuals. This means that, on average, the rate of COVID infections in prison populations is over four times the rate of COVID infections in the general population. Arkansas and Kansas continue to have a prison infection rate that is over 10 times that of the general population. 

Despite a surge of COVID cases in the general population this month, in 46 of the 50 US states, the rate of COVID infections among those imprisoned still exceeds the rate of COVID infections among the general population. In the last week, case rates have continued to increase drastically in prisons in multiple states. Case rates in prisons have increased most in Iowa, New Mexico, Utah, and Wisconsin. Iowa has seen the largest increase in case rates in the last week. The highest case rate in the state prison systems remains in South Dakota with 2,009 of its incarcerated population (529.52 per 1,000) having tested positive for COVID. 

Importantly, states have varying testing strategies within prisons and for their general population, indicating that these rates likely reflect a falsely low disease incidence with some states’ rates being more accurate than others.
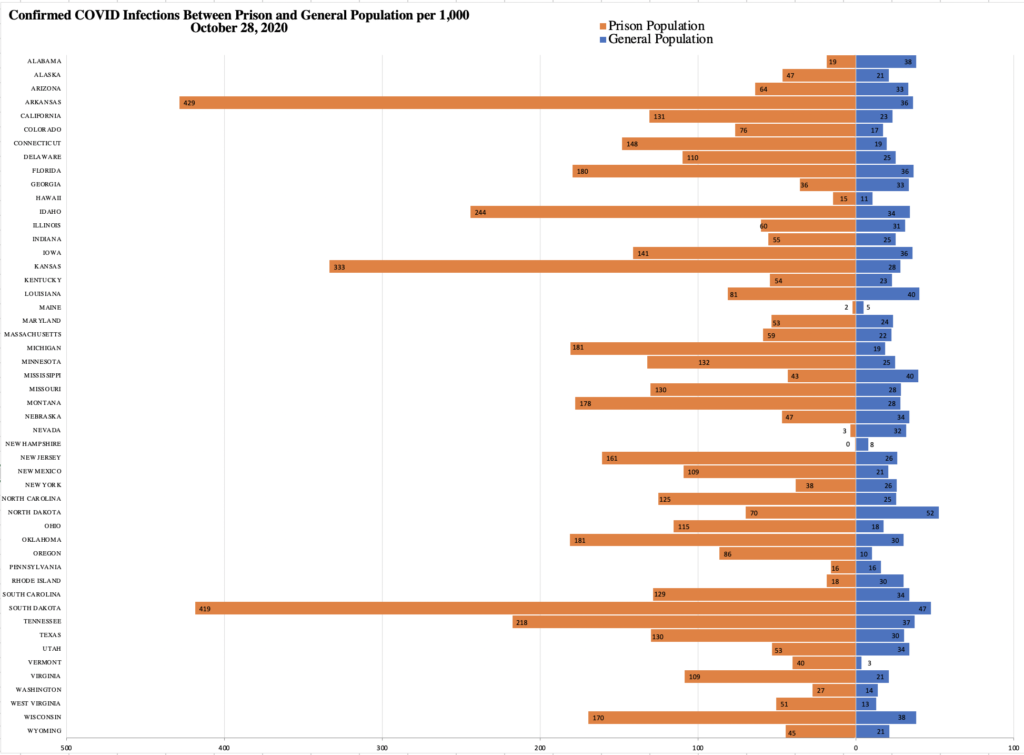
COVID Case Watch November 5, 2020

This graph shows confirmed positive cases of COVID-19 per 1,000 individuals in the prison and general populations in each state as of November 5, 2020. The left side (orange) refers to the prison population and the right side (blue) refers to the general population. 

The rate of COVID in the general population is 28.84 per 1,000 individuals. In the prison population, the rate is 119.7 per 1,000 individuals. This means that, on average, the rate of COVID infections in prison populations is 4.15 times the rate of COVID infections in the general population. Arkansas, Kansas, and Vermont continue to have a prison infection rate that is over 10 times that of the general population. 

Despite a surge of COVID cases in the general population this month, in 46 of the 50 US states, the rate of COVID infections among those imprisoned exceeds the rate of COVID infections among the general population. In the last week, case rates have continued to increase drastically in prisons in the Midwest, specifically in Minnesota, South Dakota, North Dakota, and Wisconsin. The highest case rate in the state prison systems is now in South Dakota with 1,801 of its incarcerated population (474.70 per 1,000) having tested positive for COVID. There has also been a recent large increase in case rates in prisons in Hawaii, Kansas, Maine, and Utah. 

Importantly, states have varying testing strategies within prisons and for their general population, indicating that these rates likely reflect a falsely low disease incidence with some states’ rates being more accurate than others.
COVID Case Watch October 28th, 2020

This graph shows confirmed positive cases of COVID-19 per 1,000 individuals in the prison and general populations in each state as of October 28, 2020. The left side (orange) refers to the prison population and the right side (blue) refers to the general population. 

The rate of COVID in the general population is 26.61 per 1,000 individuals. In the prison population (in state prisons), the rate is 113.35 per 1,000 individuals. This means that, on average, the rate of COVID infections in prison populations is 4.26 times the rate of COVID infections in the general population. Arkansas, Kansas, and Vermont continue to have a prison infection rate that is over 10 times that of the general population. 

Despite a surge of COVID cases in the general population this month, in 45 of the 50 US states, the rate of COVID infections among those imprisoned exceeds the rate of COVID infections among the general population. As cases have risen in the Midwest, the general population of Montana, North Dakota, South Dakota, and Wisconsin have seen an increase in case rates of 4.9-7.9 per 1,000 in the past week. However, the case rates in Midwestern prisons have increased much more. Montana, North Dakota, South Dakota, and Wisconsin prisons have seen an increase in case rates in the past week of 54 per 1,000, 16 per 1,000, 302 per 1,000, and 38 per 1,000, respectively. 

Importantly, states have varying testing strategies within prisons and for their general population, indicating that these rates likely reflect a falsely low disease incidence with some states’ rates being more accurate than others.
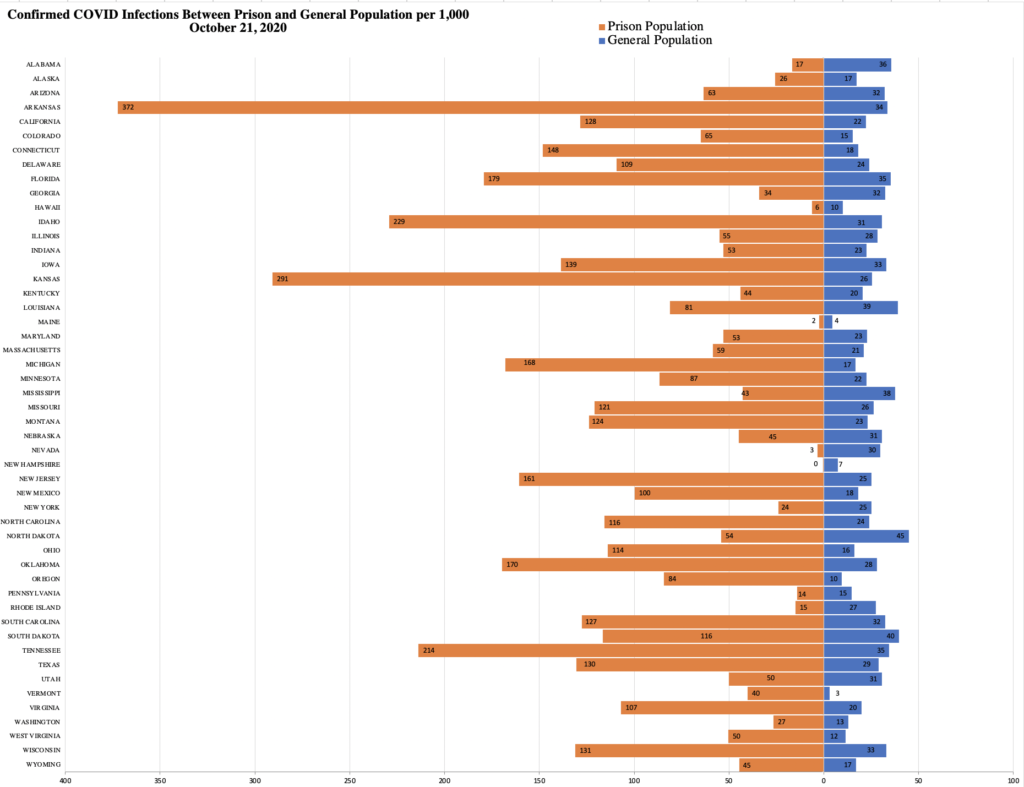
COVID Case Watch October 21, 2020

This graph shows confirmed positive cases of COVID-19 per 1,000 individuals in the prison and general populations in each state as of October 21, 2020. The left side (orange) refers to the prison population and the right side (blue) refers to the general population. 

The rate of COVID in the general population is 25.06 per 1,000 individuals. In the prison population, the rate is 106.84 per 1,000 individuals. This means that, on average, the rate of COVID infections in prison populations is 4.26 times the rate of COVID infections in the general population. Arkansas, Kansas, and Vermont continue to have a prison infection rate that is over 10 times that of the general population. In 42 of the 50 US states, the rate of COVID infections among those imprisoned exceeds the rate of COVID infections among the general population.

Importantly, states have varying testing strategies within prisons and for their general population, indicating that these rates likely reflect a falsely low disease incidence with some states’ rates being more accurate than others.

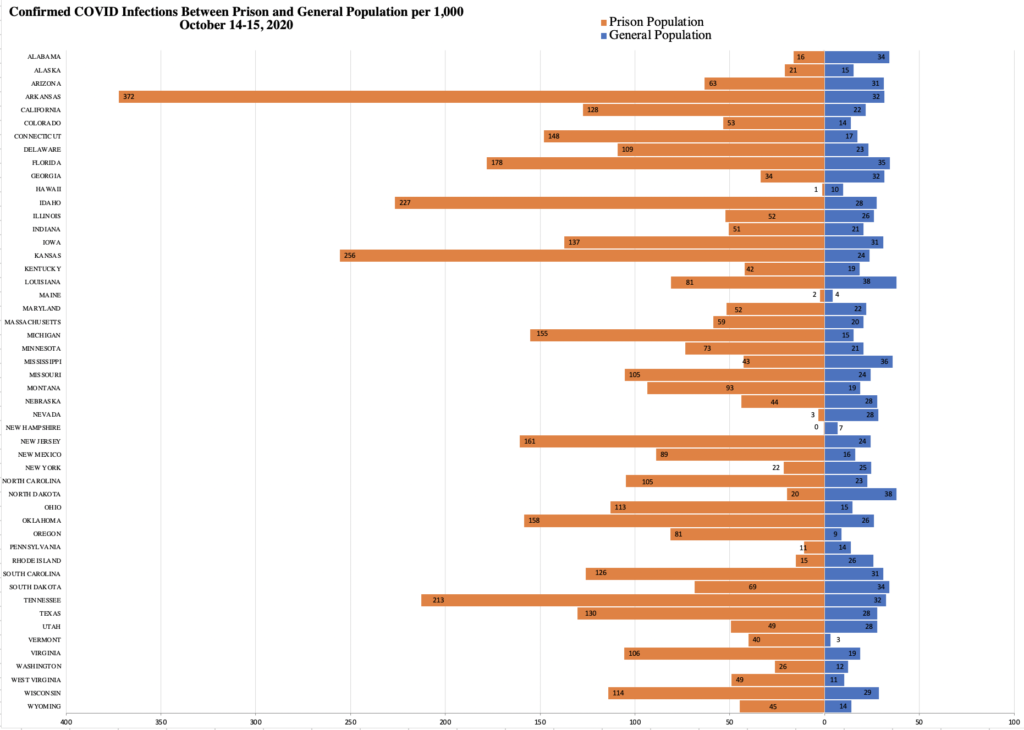
COVID Case Watch October 14-15, 2020

This graph shows confirmed positive cases of COVID-19 per 1,000 individuals in the prison and general populations in each state as of October 14 and 15, 2020.* The left side (orange) refers to the prison population and the right side (blue) refers to the general population. 

The rate of COVID in the general population is 23.81 per 1,000 individuals. In the prison population, the rate is 103.49 per 1,000 individuals. This means that, on average, the rate of COVID infections in prison populations is 4.35 times the rate of COVID infections in the general population. Arkansas, Kansas, and Vermont have a prison infection rate that is over 10 times that of the general population. In 41 of the 50 US states, the rate of COVID infections among those imprisoned exceeds the rate of COVID infections among the general population.

Importantly, states have varying testing strategies within prisons and for their general population, indicating that these rates likely reflect a falsely low disease incidence with some states’ rates being more accurate than others.

*Based on when data is updated, general population data is from October 14th and state prison data is from both October 14th and October 15th

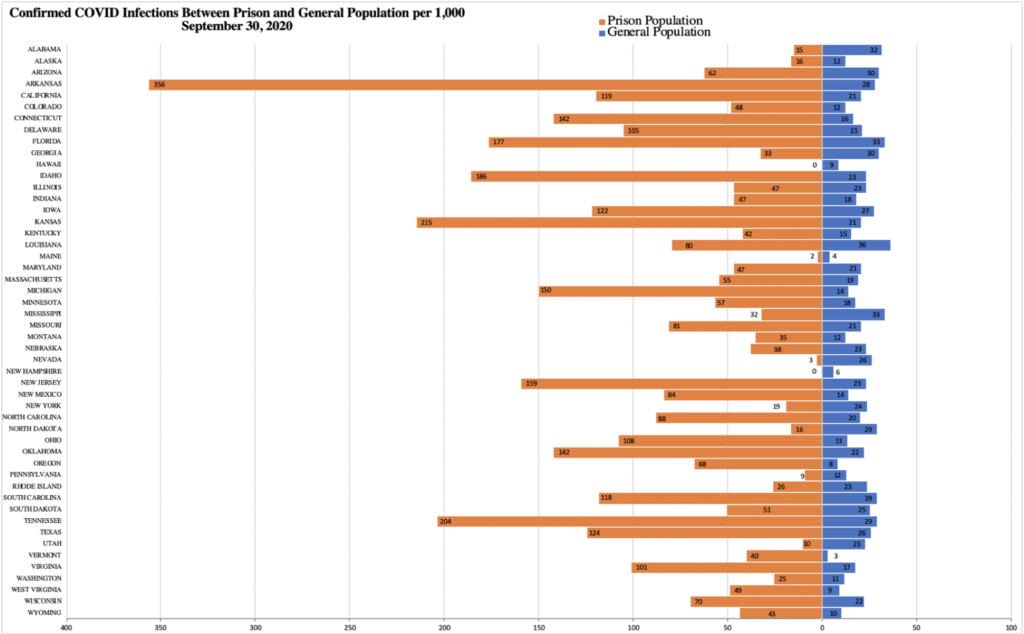
COVID Case Watch September 30, 2020

This graph shows confirmed positive cases of COVID-19 per 1,000 individuals in the prison and general populations in each state as of September 30, 2020. The left side (orange) refers to the prison population and the right side (blue) refers to the general population. 

The rate of COVID in the general population is 21.78 per 1,000 individuals. In the prison population, the rate is 96.11 per 1,000 individuals. This means that, on average, the rate of COVID infections in prison populations is 4.41 times the rate of COVID infections in the general population. Arkansas, Kansas, Michigan, and Vermont all have a prison infection rate that is over 10 times that of the general population. In 40 of the 50 US states, the rate of COVID infections among those imprisoned exceeds the rate of COVID infections among the general population.

Since these rates were last calculated by our team on August 19th, the general population has experienced an increase in cases of 5.23 per 1,000 population whereas the prison population has experienced an increase in cases of 26.11 cases per 1,000 population. 

Importantly, states have varying testing strategies within prisons and for their general population, indicating that these rates likely reflect a falsely low disease incidence with some states’ rates being more accurate than others.

Covid Prison Hotspots

This week 22 out of 53 prisons systems are classified as Covid Prison Hotspots. This is our fourth posting.

We were inspired by the Kaiser Family Foundation‘s characterization of states as “covid hotspots” based on recent changes in cases and test positivity for the general population. So we applied their analysis to prison systems! For each prison system (50 states, FBOP, ICE, and Puerto Rico), we calculated the 14-day percent change in covid cases, the 14-day percent change in test positivity (i.e., the percent of tests that return positive), and the 7-day “rolling” average for test positivity, all for incarcerated people (not staff). If a prison system reports a 5% or greater increase in covid cases over the two week period AND reports a 1% or greater increase in test positivity over the two week period OR reports an average test positivity of 10% or higher, then they are classified as a Covid Prison Hotspot.