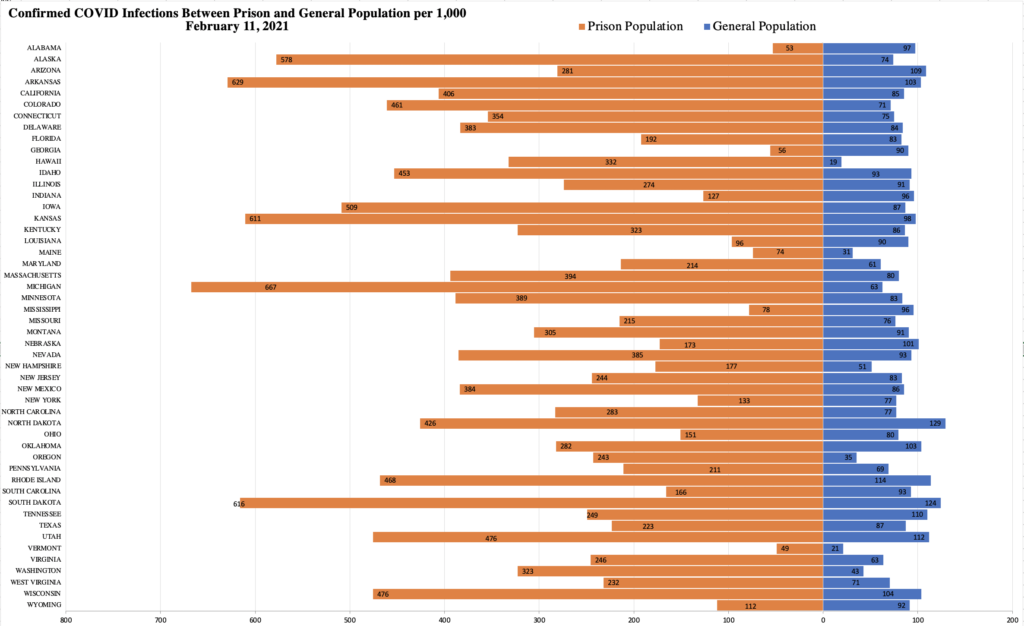
This graph shows confirmed positive cases of COVID-19 per 1,000 individuals in the prison and general populations in each state as of February 11, 2021. The left side (orange) refers to the prison population and the right side (blue) refers to the general population.
The rate of COVID in the general population is 82.50 per 1,000 individuals. In the prison population, the rate is 269.81 per 1,000 individuals. On average, the rate of COVID infections in prison populations is over 3 times the rate of COVID infections in the general population. Hawaii and Michigan continue to have prison infection rates that are over 10 times that of the state general population.
Despite the continued surge of COVID cases in the general population in the last few months, in 47 of the 50 US states, the rate of COVID infections among those imprisoned still exceeds the rate of COVID infections among the general population. The three states with a higher COVID rate in the general population continue to be in the Deep South: Alabama, Georgia, and Mississippi. In the last week, case rates have continued to increase drastically in prisons in multiple states. The largest increases in prison population case rates in the last week occurred in Wyoming and New York. The highest case rate in the state prison systems remains in Michigan with 24,681 of its incarcerated population (667.41 per 1,000) having tested positive for COVID. Over half of the state’s prison population has tested positive for COVID in Alaska, Arkansas, Iowa, Kansas, Michigan, and South Dakota.
Importantly, states have varying testing strategies within prisons and for their general population, indicating that these rates likely reflect a falsely low disease incidence with some states’ rates being more accurate than others.