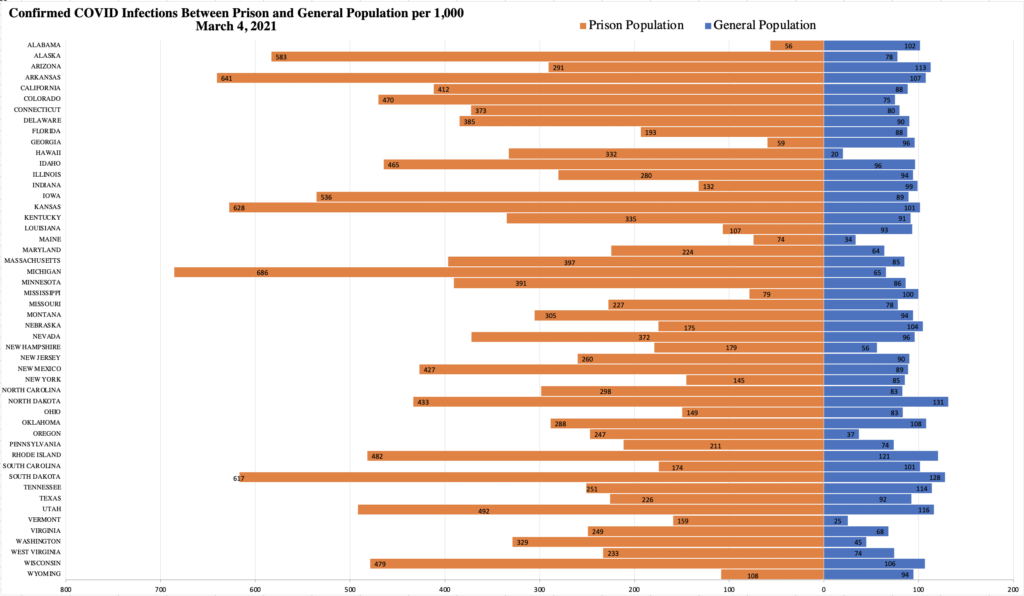
This graph shows confirmed positive cases of COVID-19 per 1,000 individuals in the prison and general populations in each state as of March 4, 2021. The left side (orange) refers to the prison population and the right side (blue) refers to the general population.
The rate of COVID in the general population is 86.81 per 1,000 individuals. In the prison population, the rate is 275.95 per 1,000 individuals. On average, the rate of COVID infections in prison populations remains over 3 times the rate of COVID infections in the general population. Hawaii and Michigan continue to have prison infection rates that are over 10 times that of the state general population.
In 47 of the 50 US states, the burden of COVID among those imprisoned still exceeds that in the general population. In the last week, the largest increases in prison population case rates in the last week occurred in Montana and Vermont. While 90 of Vermont’s 1,369 incarcerated people had received a positive COVID test by last week, 218 had received a positive test by today. The highest case rate in the state prison systems remains in Michigan with 25,359 of its incarcerated population (685.75 per 1,000) having tested positive for COVID. Over half of the state’s prison population has tested positive for COVID in Alaska, Arkansas, Iowa, Kansas, Michigan, and South Dakota.
Importantly, states have varying testing strategies within prisons and for their general population, indicating that these rates likely reflect a falsely low disease incidence with some states’ rates being more accurate than others.