Take the INSIDE Survey to shed light on the COVID-19 crisis in carceral facilities

Current public health efforts to address COVID-19 in carceral facilities have ignored the voices of those trapped with COVID-19 while incarcerated.

The Harvard-based Liberation Lab has developed a survey in partnership with formerly incarcerated people to give voice to those who are incarcerated during the pandemic. In the words of Angela Davis “prisons do not disappear problems, they disappear human beings,” and lack of transparency is a familiar strategy to hide oppression and structural violence.

What is the study?

  • Collecting information on conditions of confinement experienced by those who are incarcerated
  • The survey can bring to light the inhumane conditions incarcerated people are facing
  • Information collected by a short, anonymous, online survey

Who is eligible?

  • Formerly incarcerated adults, freed after March 2020
  • Any adult in communication with someone who is currently incarcerated

View preliminary results of the survey here
Updates to CPP’s Dataset

Currently, CPP publishes five primary variables to the public: incarcerated positive, incarcerated tested, incarcerated deaths, staff positive, and staff deaths. However, we have been collecting all data reported by state Department of Corrections (DOC) since April of 2020. This includes additional variables such as the number of incarcerated people who have recovered from COVID-19 and the number of current active cases of COVID-19. We have been in the process of thoroughly cleaning this larger dataset, addressing discrepancies in the data, and contacting DOC’s for clarification on variables they are reporting.

In preparation for the release of this important dataset, we wanted to share several disclaimers and provide links to documents that keep track of the definitions we are using and inconsistencies in reporting:

  1. We sometimes have to perform our own calculations for cumulative variables. For example, for some systems, we calculate positive cases by combining the number of reported active and recovered cases. Our data dictionary keeps a record of how each DOC defines these variables and how CPP defines these variables. The data dictionary also keeps track of any changes in data reporting and any facilities excluded by CPP (for example, parole facilities that do not house incarcerated people overnight).
  2. We also have a daily running data log that keeps track of data discrepancies and data entry errors when they arise. Any errors are rectified immediately and any changes in data reporting are recorded in our data dictionary.
  3. There have been several cases where cumulative data will decrease on the DOC’s website. When this occurs, we reach out to DOC’s for explanation. Sometimes, we get a response indicating that this change was due to a data entry error on their part or a change in how they are reporting a certain variable. Most of the time, we do not get a response and must leave the data as reported by each DOC.

We are looking forward to reaching this milestone for the Covid Prison Project! If you have any questions or comments about how we are recording and reporting our data, feel free to contact us at healthandjustice@unc.edu.

COVID Case Watch December 10, 2020

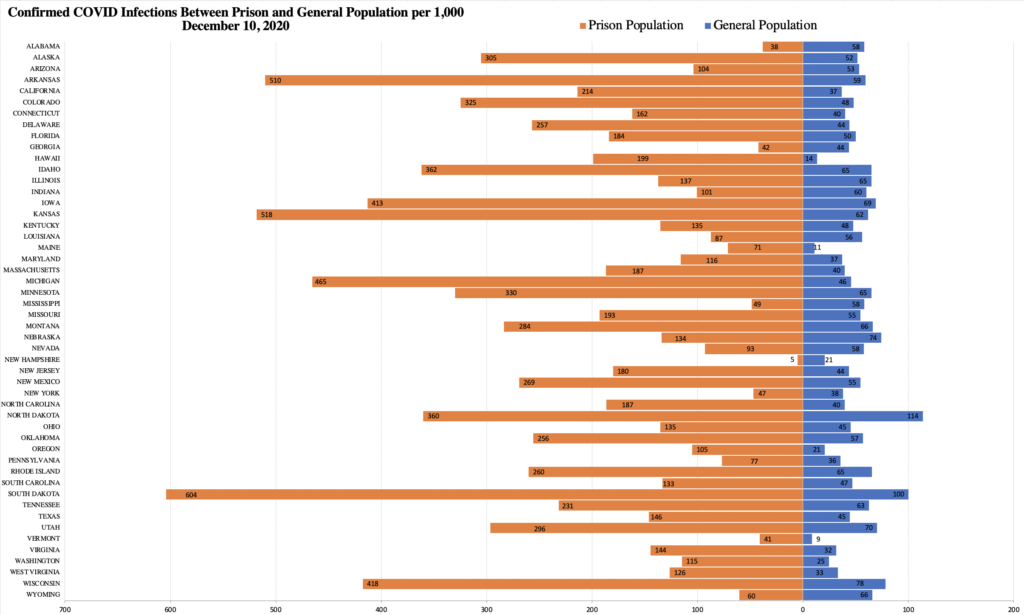
This graph shows confirmed positive cases of COVID-19 per 1,000 individuals in the prison and general populations in each state as of December 10, 2020. The left side (orange) refers to the prison population and the right side (blue) refers to the general population. 

The rate of COVID in the general population is 46.61 per 1,000 individuals. In the prison population, the rate is 176.33 per 1,000 individuals. On average, the rate of COVID infections in prison populations remains almost four times the rate of COVID infections in the general population. Hawaii and Michigan have prison infection rates that are over 10 times that of the state general population. 

Despite the recent surge of COVID cases in the general population in the last two months, in 45 of the 50 US states, the rate of COVID infections among those imprisoned still exceeds the rate of COVID infections among the general population. In the last two weeks, case rates have continued to increase drastically in prisons in multiple states. The largest increase in prison population cases this past week has occurred in Rhode Island. Last week, 283 of the state’s 2,395 incarcerated population had tested positive. By this week, 623 had tested positive. Case rates in prisons have also increased drastically in Alaska, Colorado, Delaware, Idaho, Michigan, Utah, and Washington. The highest case rate in the state prison systems remains in South Dakota with 2,292 of its incarcerated population (604.11 per 1,000) having tested positive for COVID. 

Importantly, states have varying testing strategies within prisons and for their general population, indicating that these rates likely reflect a falsely low disease incidence with some states’ rates being more accurate than others.


COVID Case Watch December 2, 2020

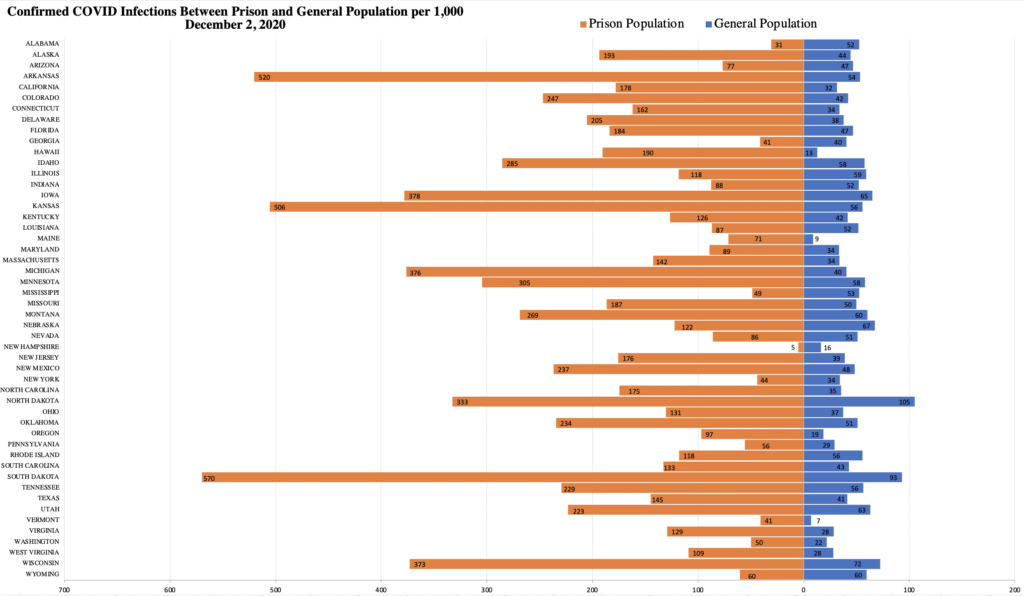
This graph shows confirmed positive cases of COVID-19 per 1,000 individuals in the prison and general populations in each state as of December 2, 2020. The left side (orange) refers to the prison population and the right side (blue) refers to the general population. 

The rate of COVID in the general population is 41.60 per 1,000 individuals. In the prison population, the rate is 158.50 per 1,000 individuals. This means that, on average, the rate of COVID infections in prison populations remains almost four times the rate of COVID infections in the general population. Hawaii has a prison infection rate that is over 10 times that of the general population. 

Despite the recent surge of COVID cases in the general population in the last two months, in 47 of the 50 US states, the rate of COVID infections among those imprisoned still exceeds the rate of COVID infections among the general population. In the last two weeks, case rates have continued to increase drastically in prisons in multiple states. The largest increase in prison population cases this past two weeks has occurred in Alaska. Two weeks ago, 399 of the state’s 3,985 incarcerated population had tested positive. By this week, 771 had tested positive. Case rates in prisons have also increased drastically in Colorado, Delaware, Hawaii, Michigan, Missouri, Rhode Island, and Wisconsin. The highest case rate in the state prison systems remains in South Dakota with 2,161 of its incarcerated population (569.58 per 1,000) having tested positive for COVID. 

Importantly, states have varying testing strategies within prisons and for their general population, indicating that these rates likely reflect a falsely low disease incidence with some states’ rates being more accurate than others.

MO: Changes in data reporting

On November 9th, Missouri stopped reporting deaths of incarcerated people and staff and the number of incarcerated people tested for COVID-19. On November 24th, CPP began reporting these variables as not reported (“NR”). On November 25th, Missouri resumed reporting of deaths but did not resume reporting the number of people tested. CPP reached out to Missouri’s DOC to understand why there was a change in data reporting and have not yet received a response.

COVID Case Watch November 19, 2020

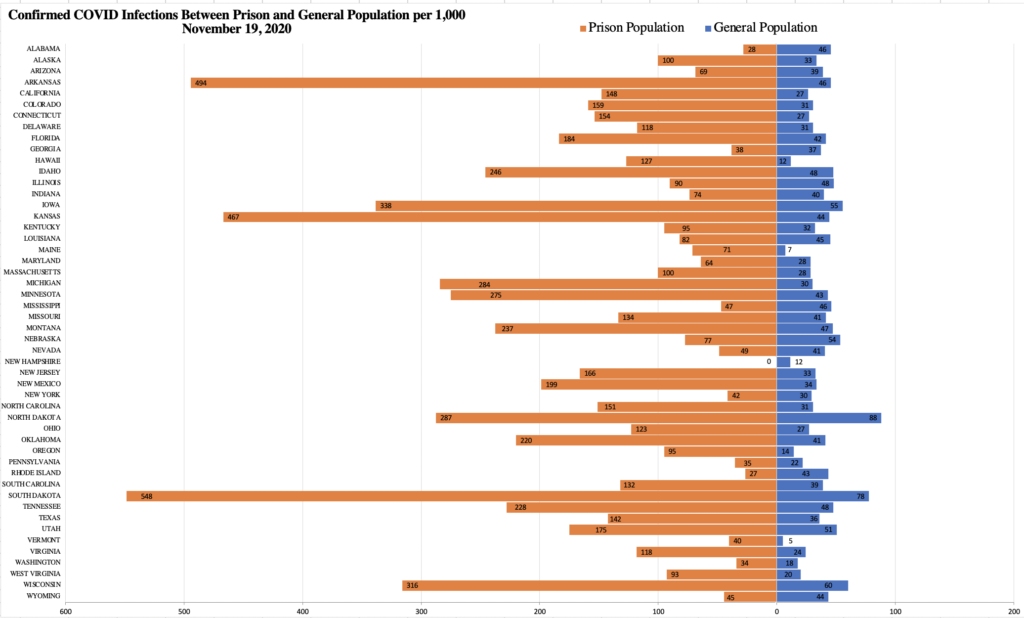
This graph shows confirmed positive cases of COVID-19 per 1,000 individuals in the prison and general populations in each state as of November 19, 2020. The left side (orange) refers to the prison population and the right side (blue) refers to the general population. 

The rate of COVID in the general population is 34.51 per 1,000 individuals. In the prison population, the rate is 138.97 per 1,000 individuals. This means that, on average, the rate of COVID infections in prison populations remains over four times the rate of COVID infections in the general population. Arkansas, Hawaii, Kansas, and Maine have a prison infection rate that is over 10 times that of the general population. 

Despite the recent surge of COVID cases in the general population this month, in 47 of the 50 US states, the rate of COVID infections among those imprisoned exceeds the rate of COVID infections among the general population. In the last week, case rates have continued to increase drastically in prisons in multiple states. The largest increase in both the general and prison population cases this past week has occurred in North Dakota, emphasizing that COVID spreads quickly from communities to prisons. Last week, 190 of the state’s 1,461 incarcerated population had tested positive. By this week, 420 had tested positive. Case rates in prisons have also increased drastically in Colorado, Iowa, Kansas, Michigan, Minnesota, and Wisconsin. The highest case rate in the state prison systems remains in South Dakota with 2,081 of its incarcerated population (548.50 per 1,000) having tested positive for COVID. 

Importantly, states have varying testing strategies within prisons and for their general population, indicating that these rates likely reflect a falsely low disease incidence with some states’ rates being more accurate than others.

CO: Changes in data reporting; count decrease

Colorado began reporting cumulative inmate positives and inmates tested under different variable names. With these changes, there was a significant decrease in the reported number of incarcerated people tested for COVID-19. CPP was told by a DOC representative that this decrease was due to changes in data reporting and that these values will likely continue to fluctuate until data has been merged to their new system.

COVID Case Watch November 12, 2020

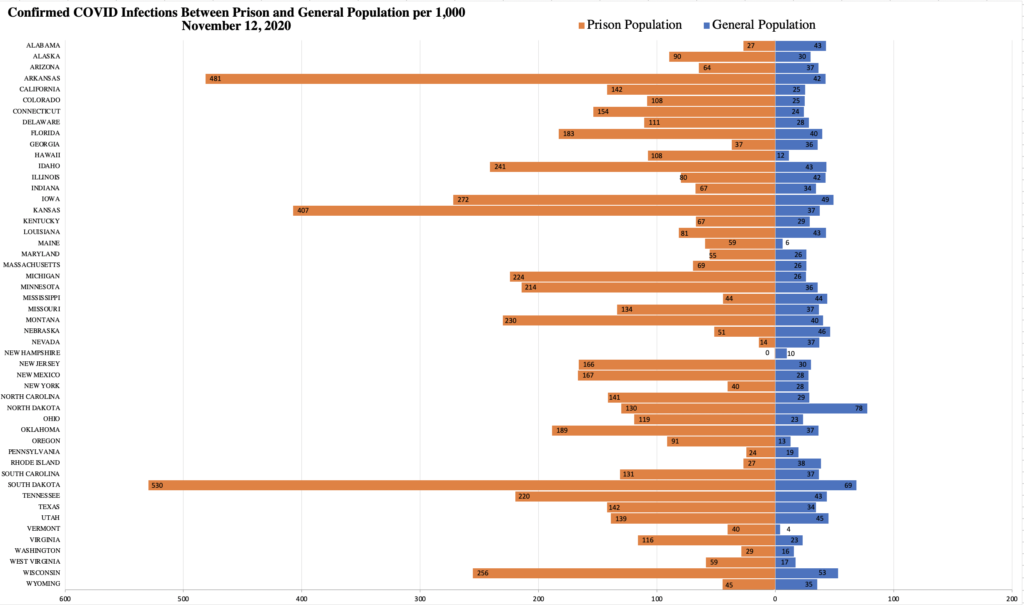
This graph shows confirmed positive cases of COVID-19 per 1,000 individuals in the prison and general populations in each state as of November 12, 2020. The left side (orange) refers to the prison population and the right side (blue) refers to the general population. 

The rate of COVID in the general population is 31.60 per 1,000 individuals. In the prison population, the rate is 127.93 per 1,000 individuals. This means that, on average, the rate of COVID infections in prison populations is over four times the rate of COVID infections in the general population. Arkansas and Kansas continue to have a prison infection rate that is over 10 times that of the general population. 

Despite a surge of COVID cases in the general population this month, in 46 of the 50 US states, the rate of COVID infections among those imprisoned still exceeds the rate of COVID infections among the general population. In the last week, case rates have continued to increase drastically in prisons in multiple states. Case rates in prisons have increased most in Iowa, New Mexico, Utah, and Wisconsin. Iowa has seen the largest increase in case rates in the last week. The highest case rate in the state prison systems remains in South Dakota with 2,009 of its incarcerated population (529.52 per 1,000) having tested positive for COVID. 

Importantly, states have varying testing strategies within prisons and for their general population, indicating that these rates likely reflect a falsely low disease incidence with some states’ rates being more accurate than others.

COVID Case Watch November 5, 2020

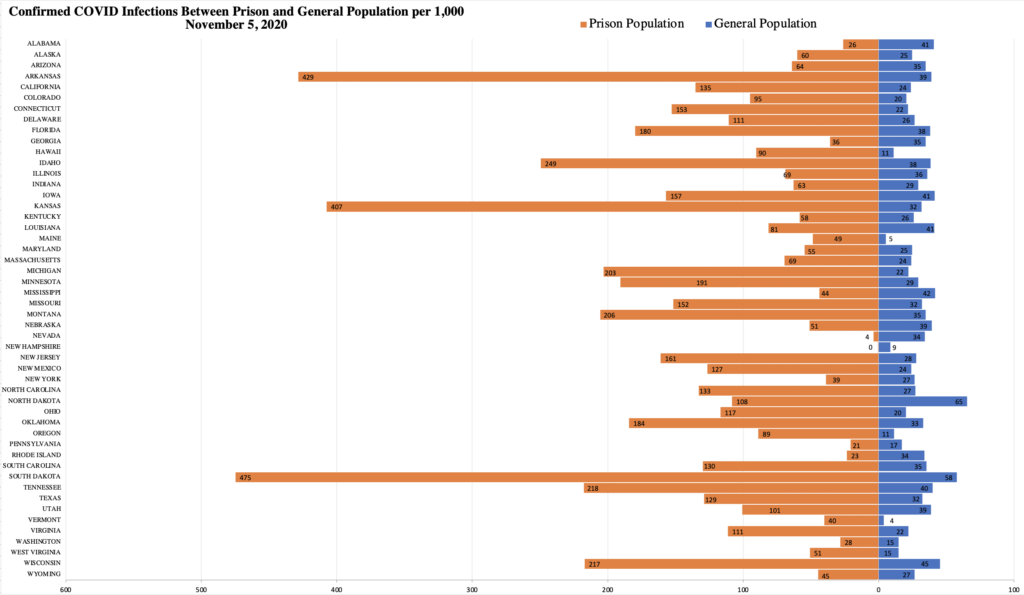
This graph shows confirmed positive cases of COVID-19 per 1,000 individuals in the prison and general populations in each state as of November 5, 2020. The left side (orange) refers to the prison population and the right side (blue) refers to the general population. 

The rate of COVID in the general population is 28.84 per 1,000 individuals. In the prison population, the rate is 119.7 per 1,000 individuals. This means that, on average, the rate of COVID infections in prison populations is 4.15 times the rate of COVID infections in the general population. Arkansas, Kansas, and Vermont continue to have a prison infection rate that is over 10 times that of the general population. 

Despite a surge of COVID cases in the general population this month, in 46 of the 50 US states, the rate of COVID infections among those imprisoned exceeds the rate of COVID infections among the general population. In the last week, case rates have continued to increase drastically in prisons in the Midwest, specifically in Minnesota, South Dakota, North Dakota, and Wisconsin. The highest case rate in the state prison systems is now in South Dakota with 1,801 of its incarcerated population (474.70 per 1,000) having tested positive for COVID. There has also been a recent large increase in case rates in prisons in Hawaii, Kansas, Maine, and Utah. 

Importantly, states have varying testing strategies within prisons and for their general population, indicating that these rates likely reflect a falsely low disease incidence with some states’ rates being more accurate than others.